8. Discover and Create Features with FeatureByte Copilot
FeatureByte offers two primary methods for feature creation:
- Manually: Utilize the SDK declarative framework
- Automatically: Employ FeatureByte Copilot
In this tutorial, we'll focus on automatic feature creation using FeatureByte Copilot.
Note
If you want to learn how to manually create features, please consult our SDK tutorials.
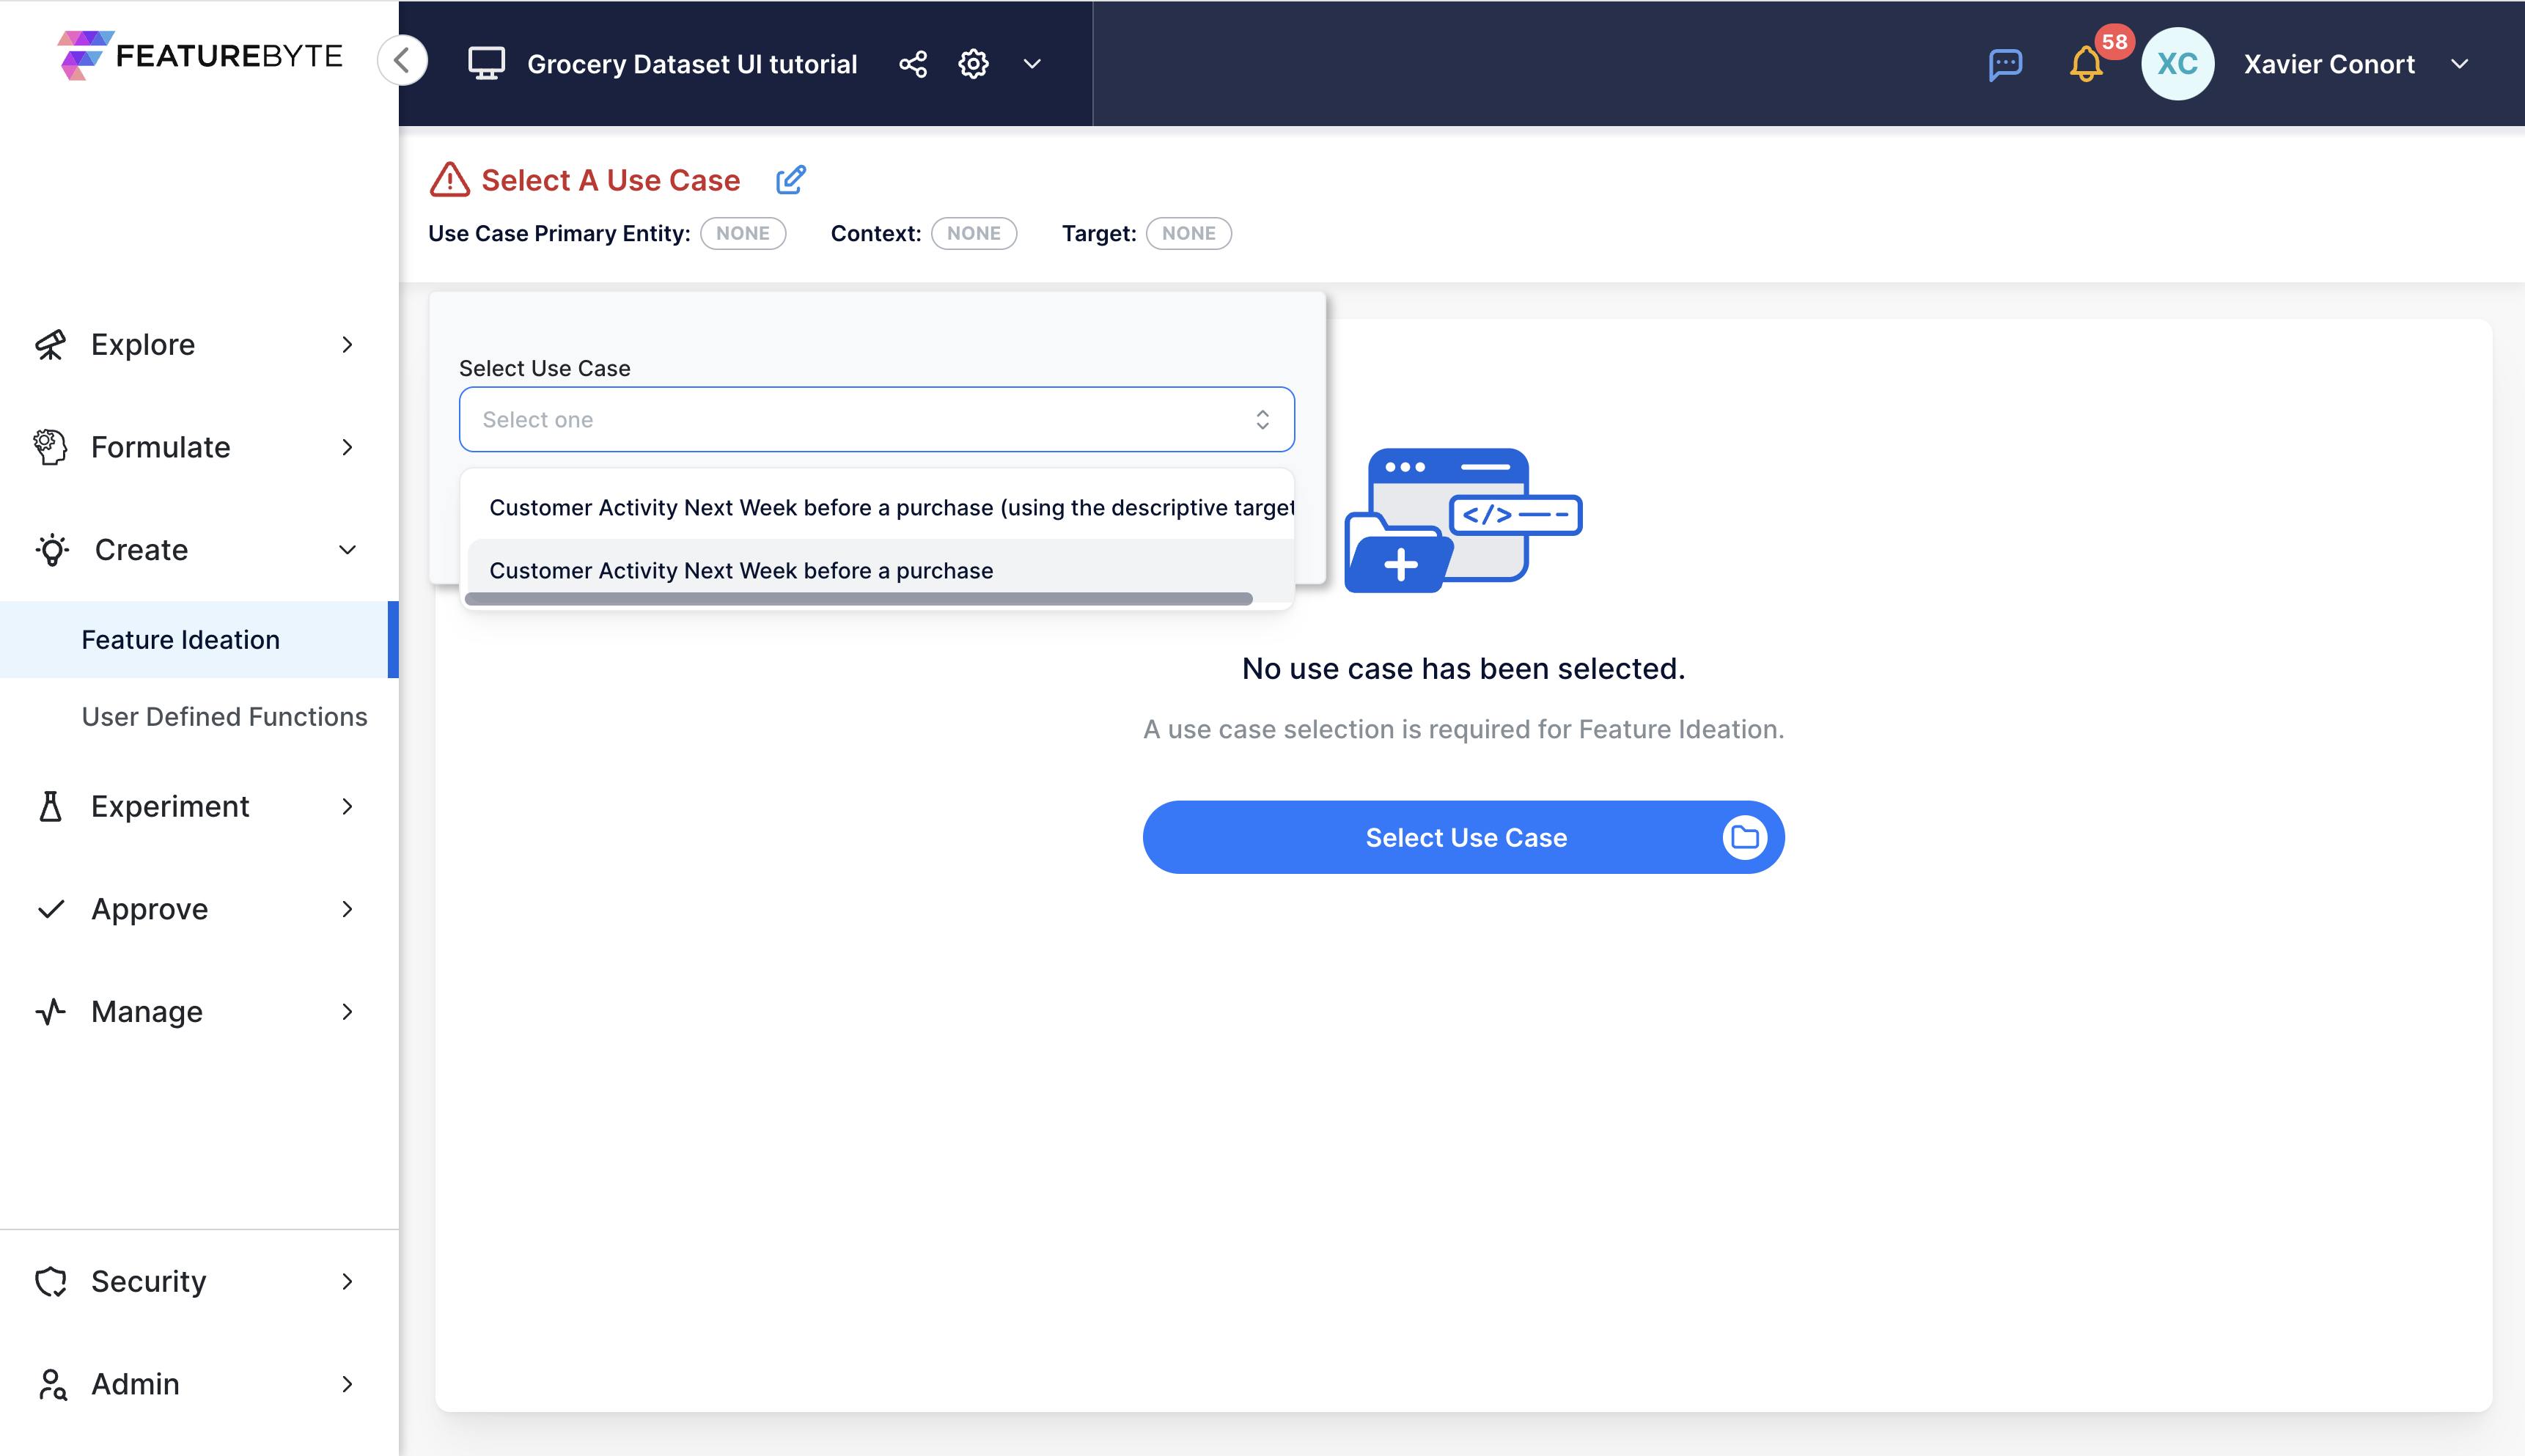
Step 1: Select Your Use Case
Navigate to Feature Ideation from the Create section of the menu.
Choose the use case: "Customer Activity Next Week before a purchase". If you could not create the target in the SDK, choose "Customer Activity Next Week before a purchase (using the descriptive target)"
Step 2: Run Semantics Detection
Click 'Run Semantics Detection' to let FeatureByte identify and tag relevant tables and data columns.
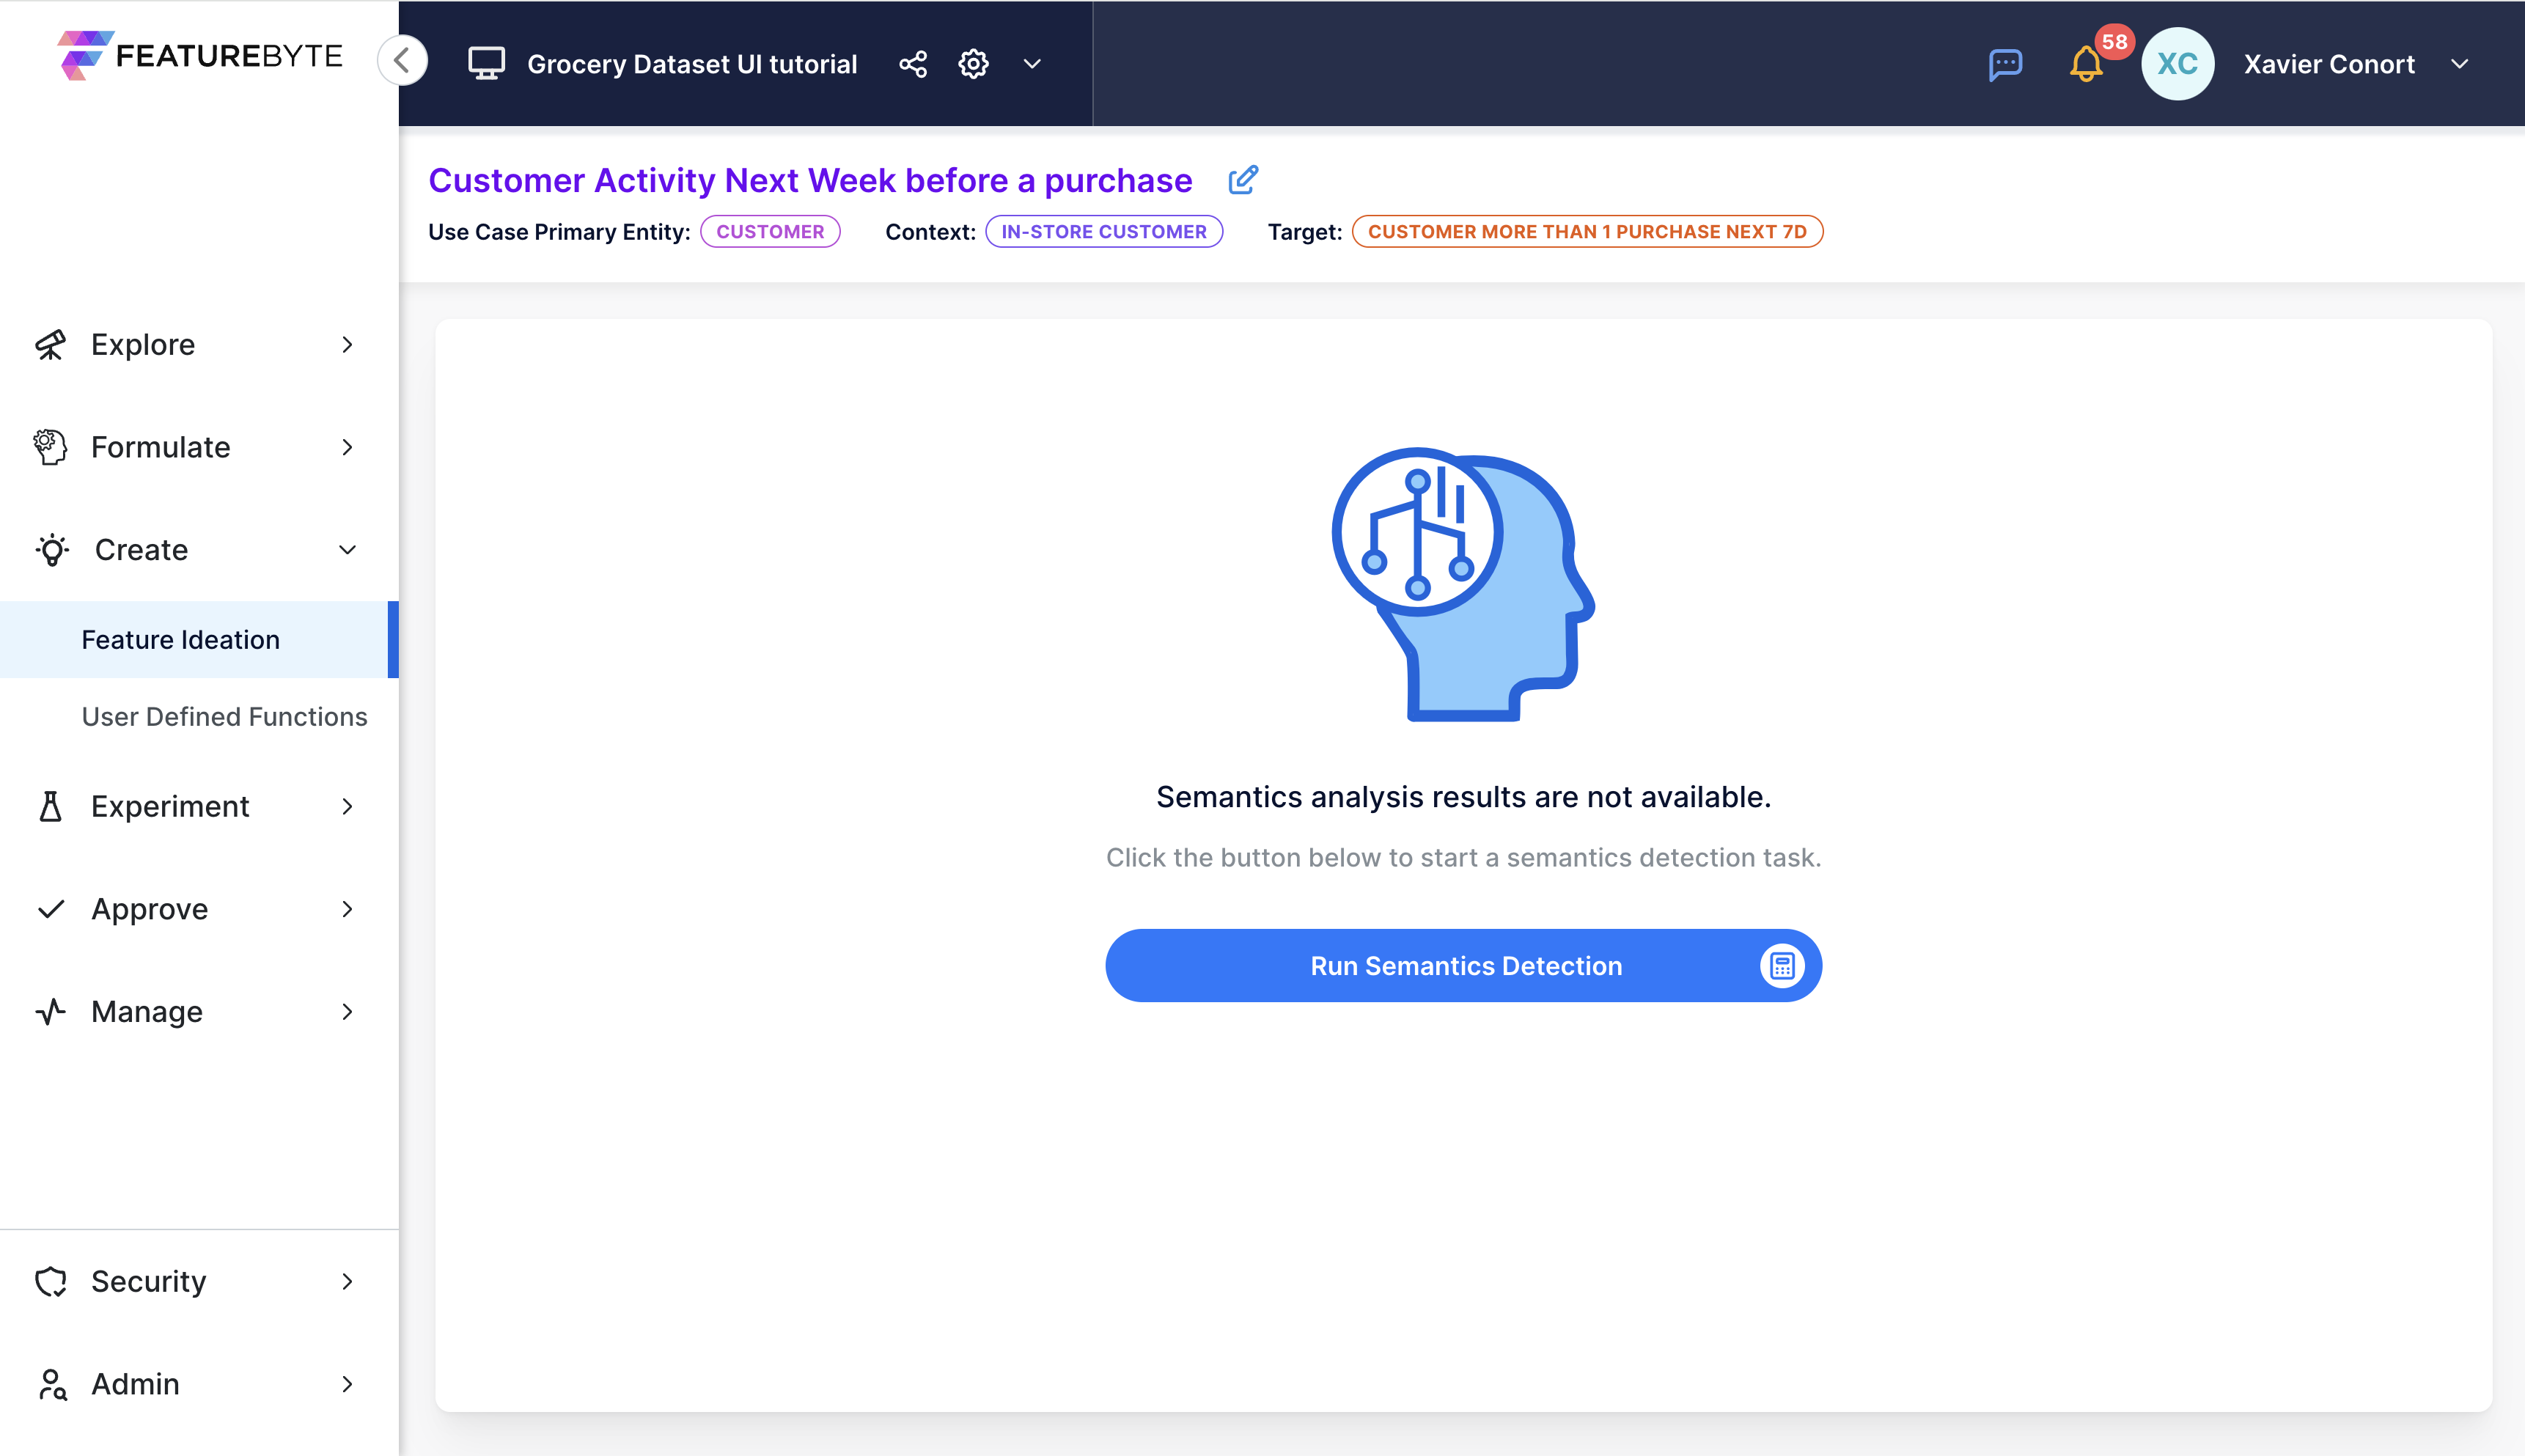
If the columns aren’t tagged correctly, check the suggested tags and make adjustments.
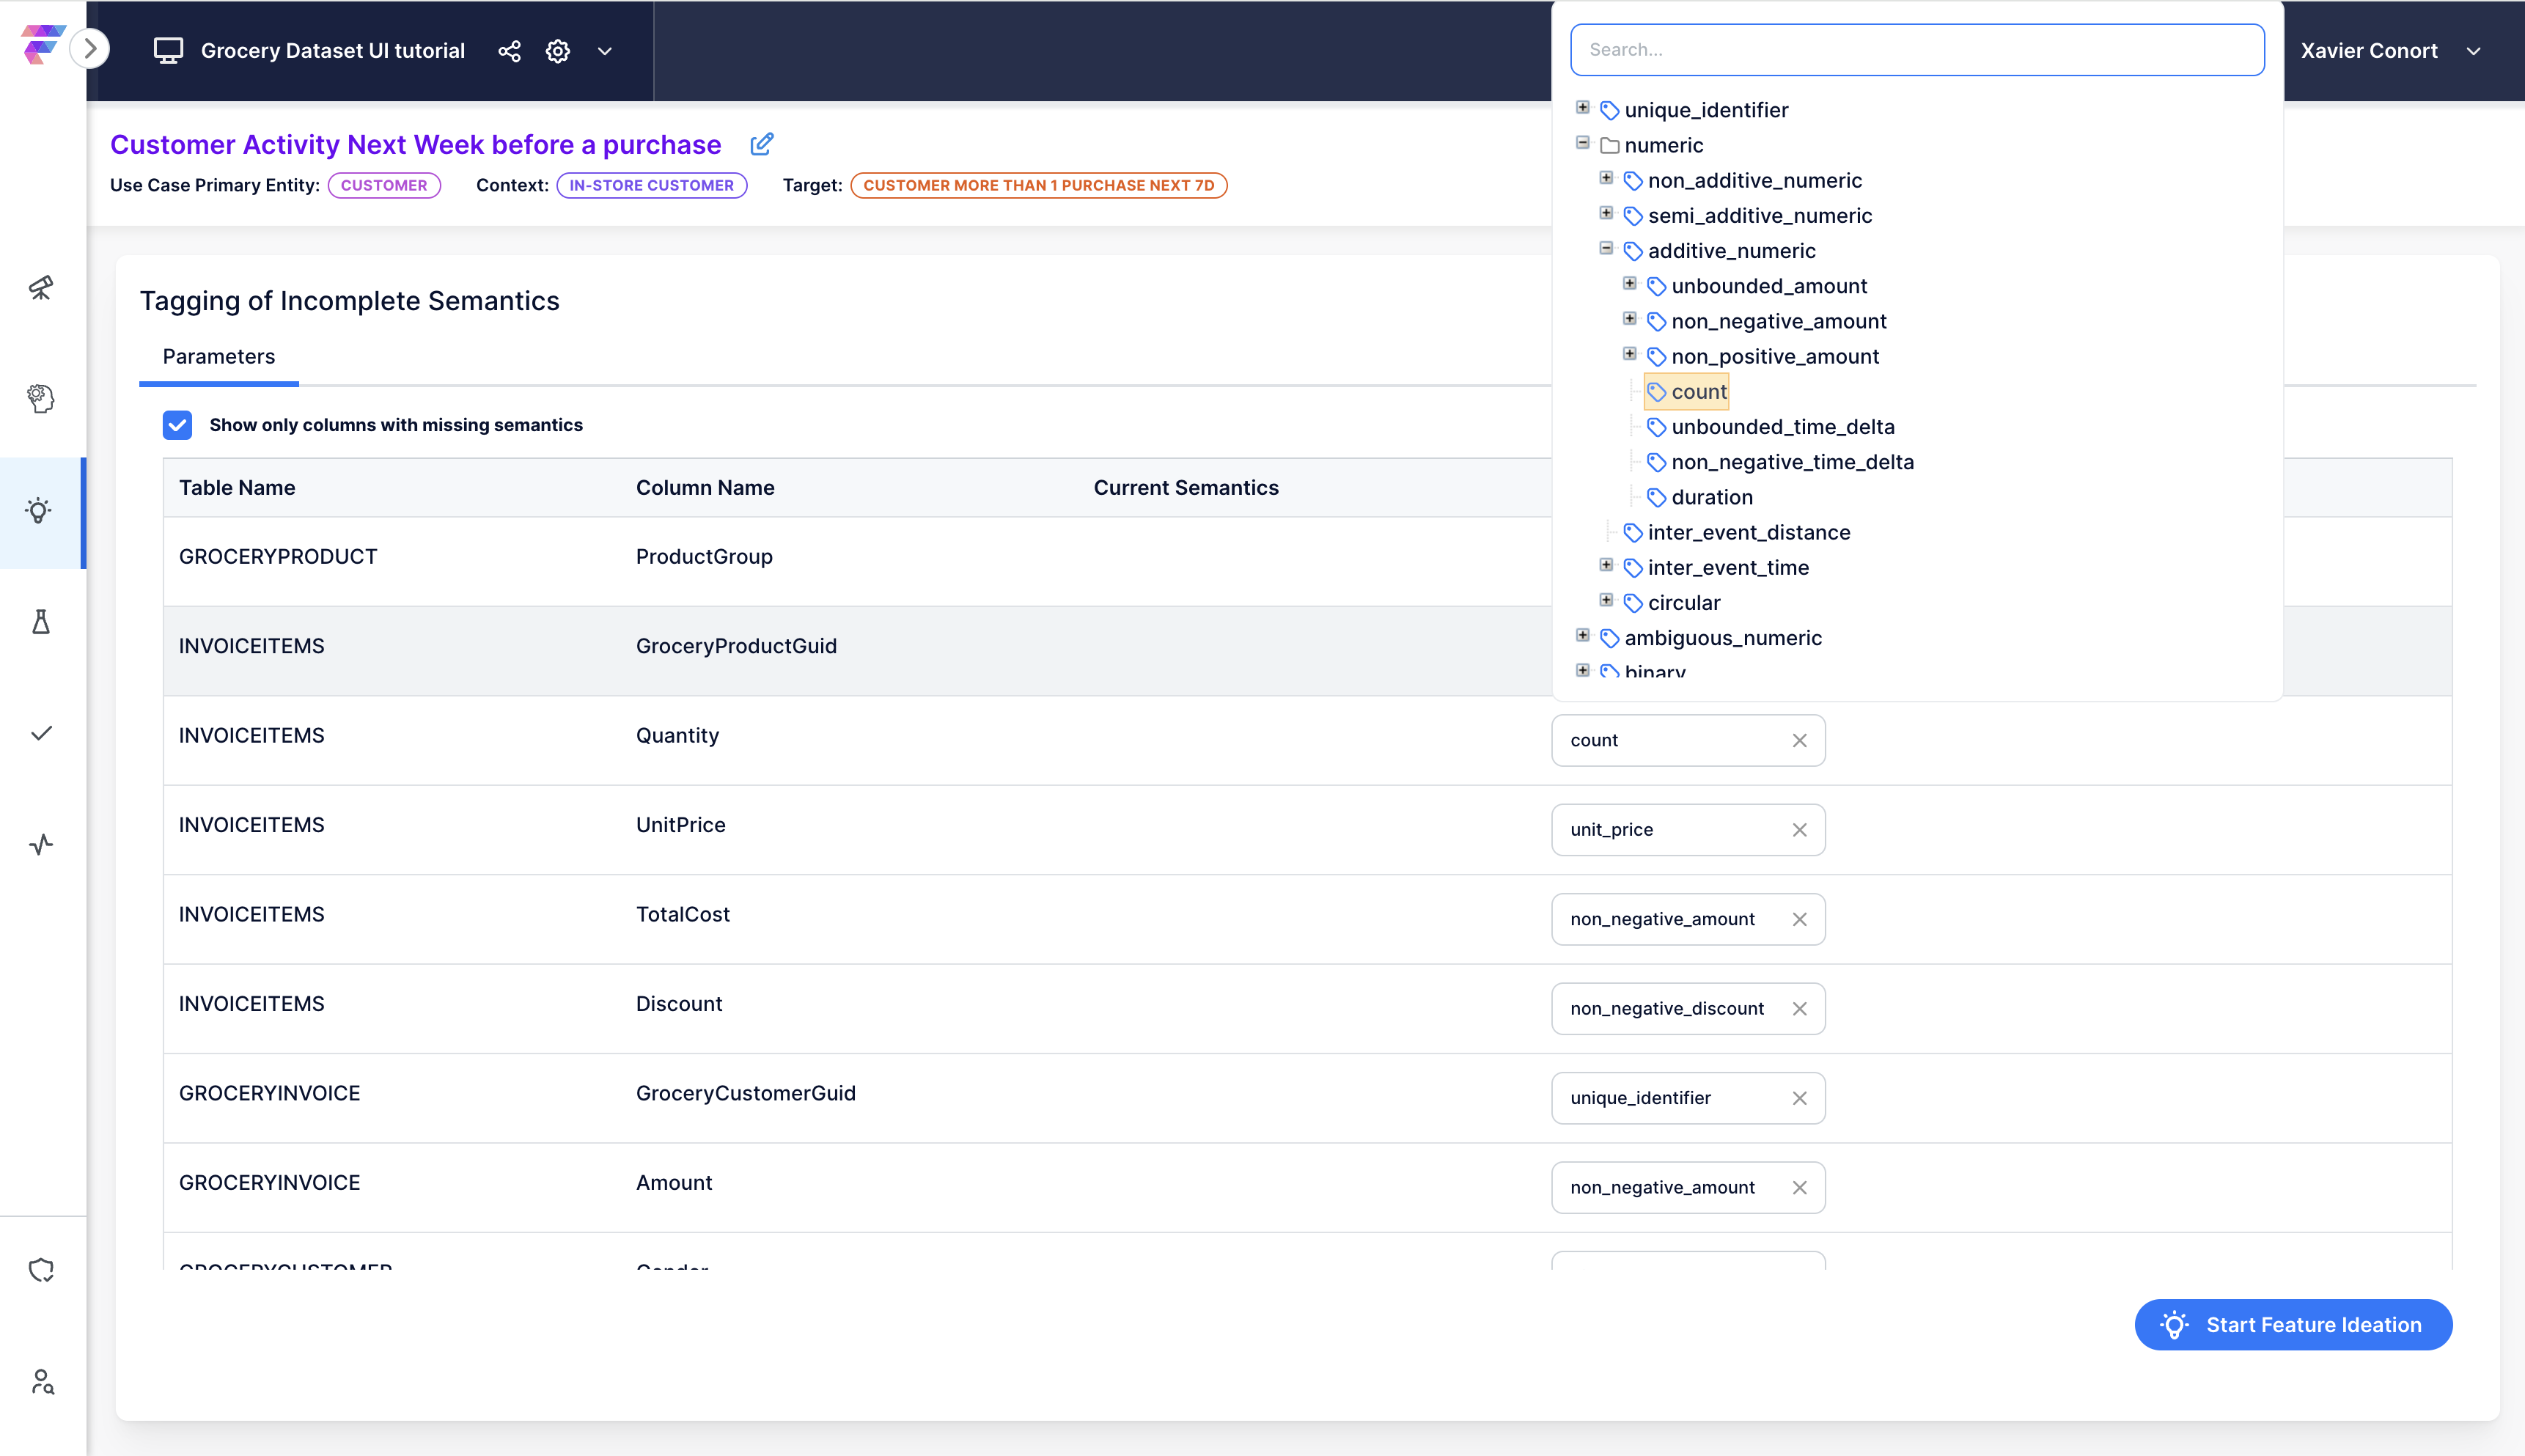
Note
The accuracy of suggestions improves with more detailed data descriptions. Refer to our tutorial "Add descriptions and Tag Semantics" to update table and columns descriptions.
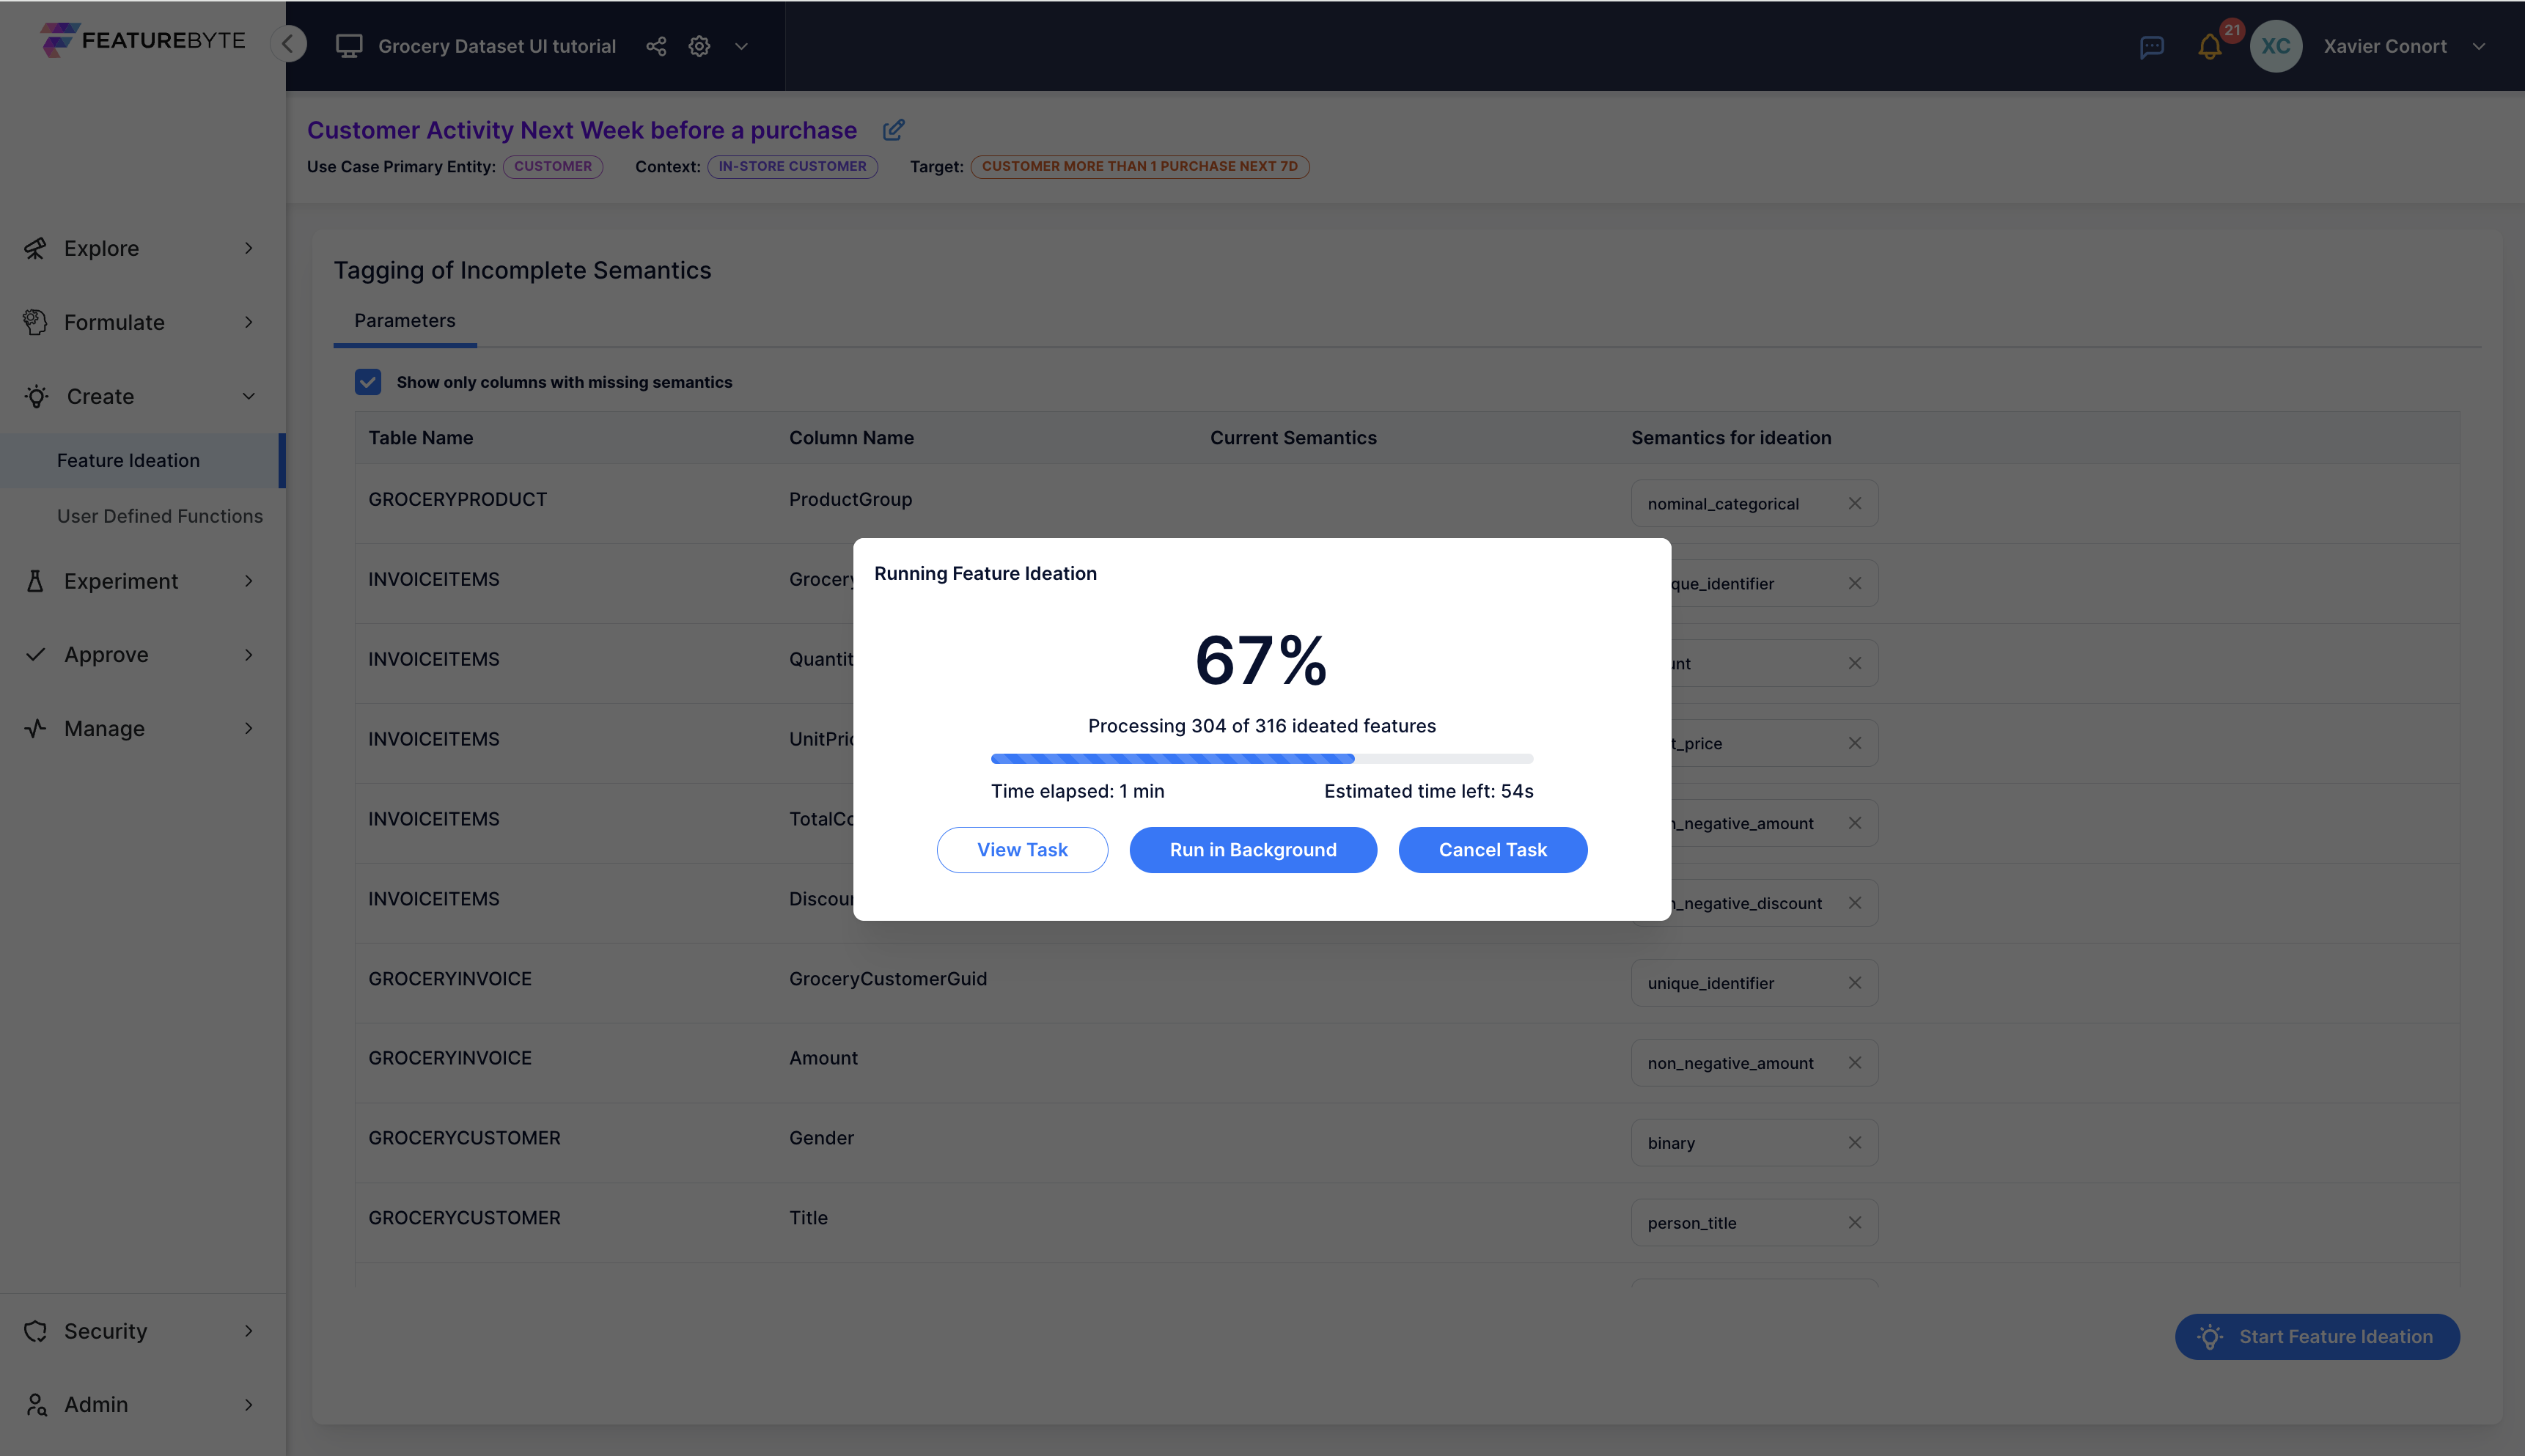
Step 3: Initiate Feature Ideation
Start the Feature Ideation process by clicking 
Step 4: Evaluate Feature Engineering Strategy
Review the configuration suggested by Copilot.
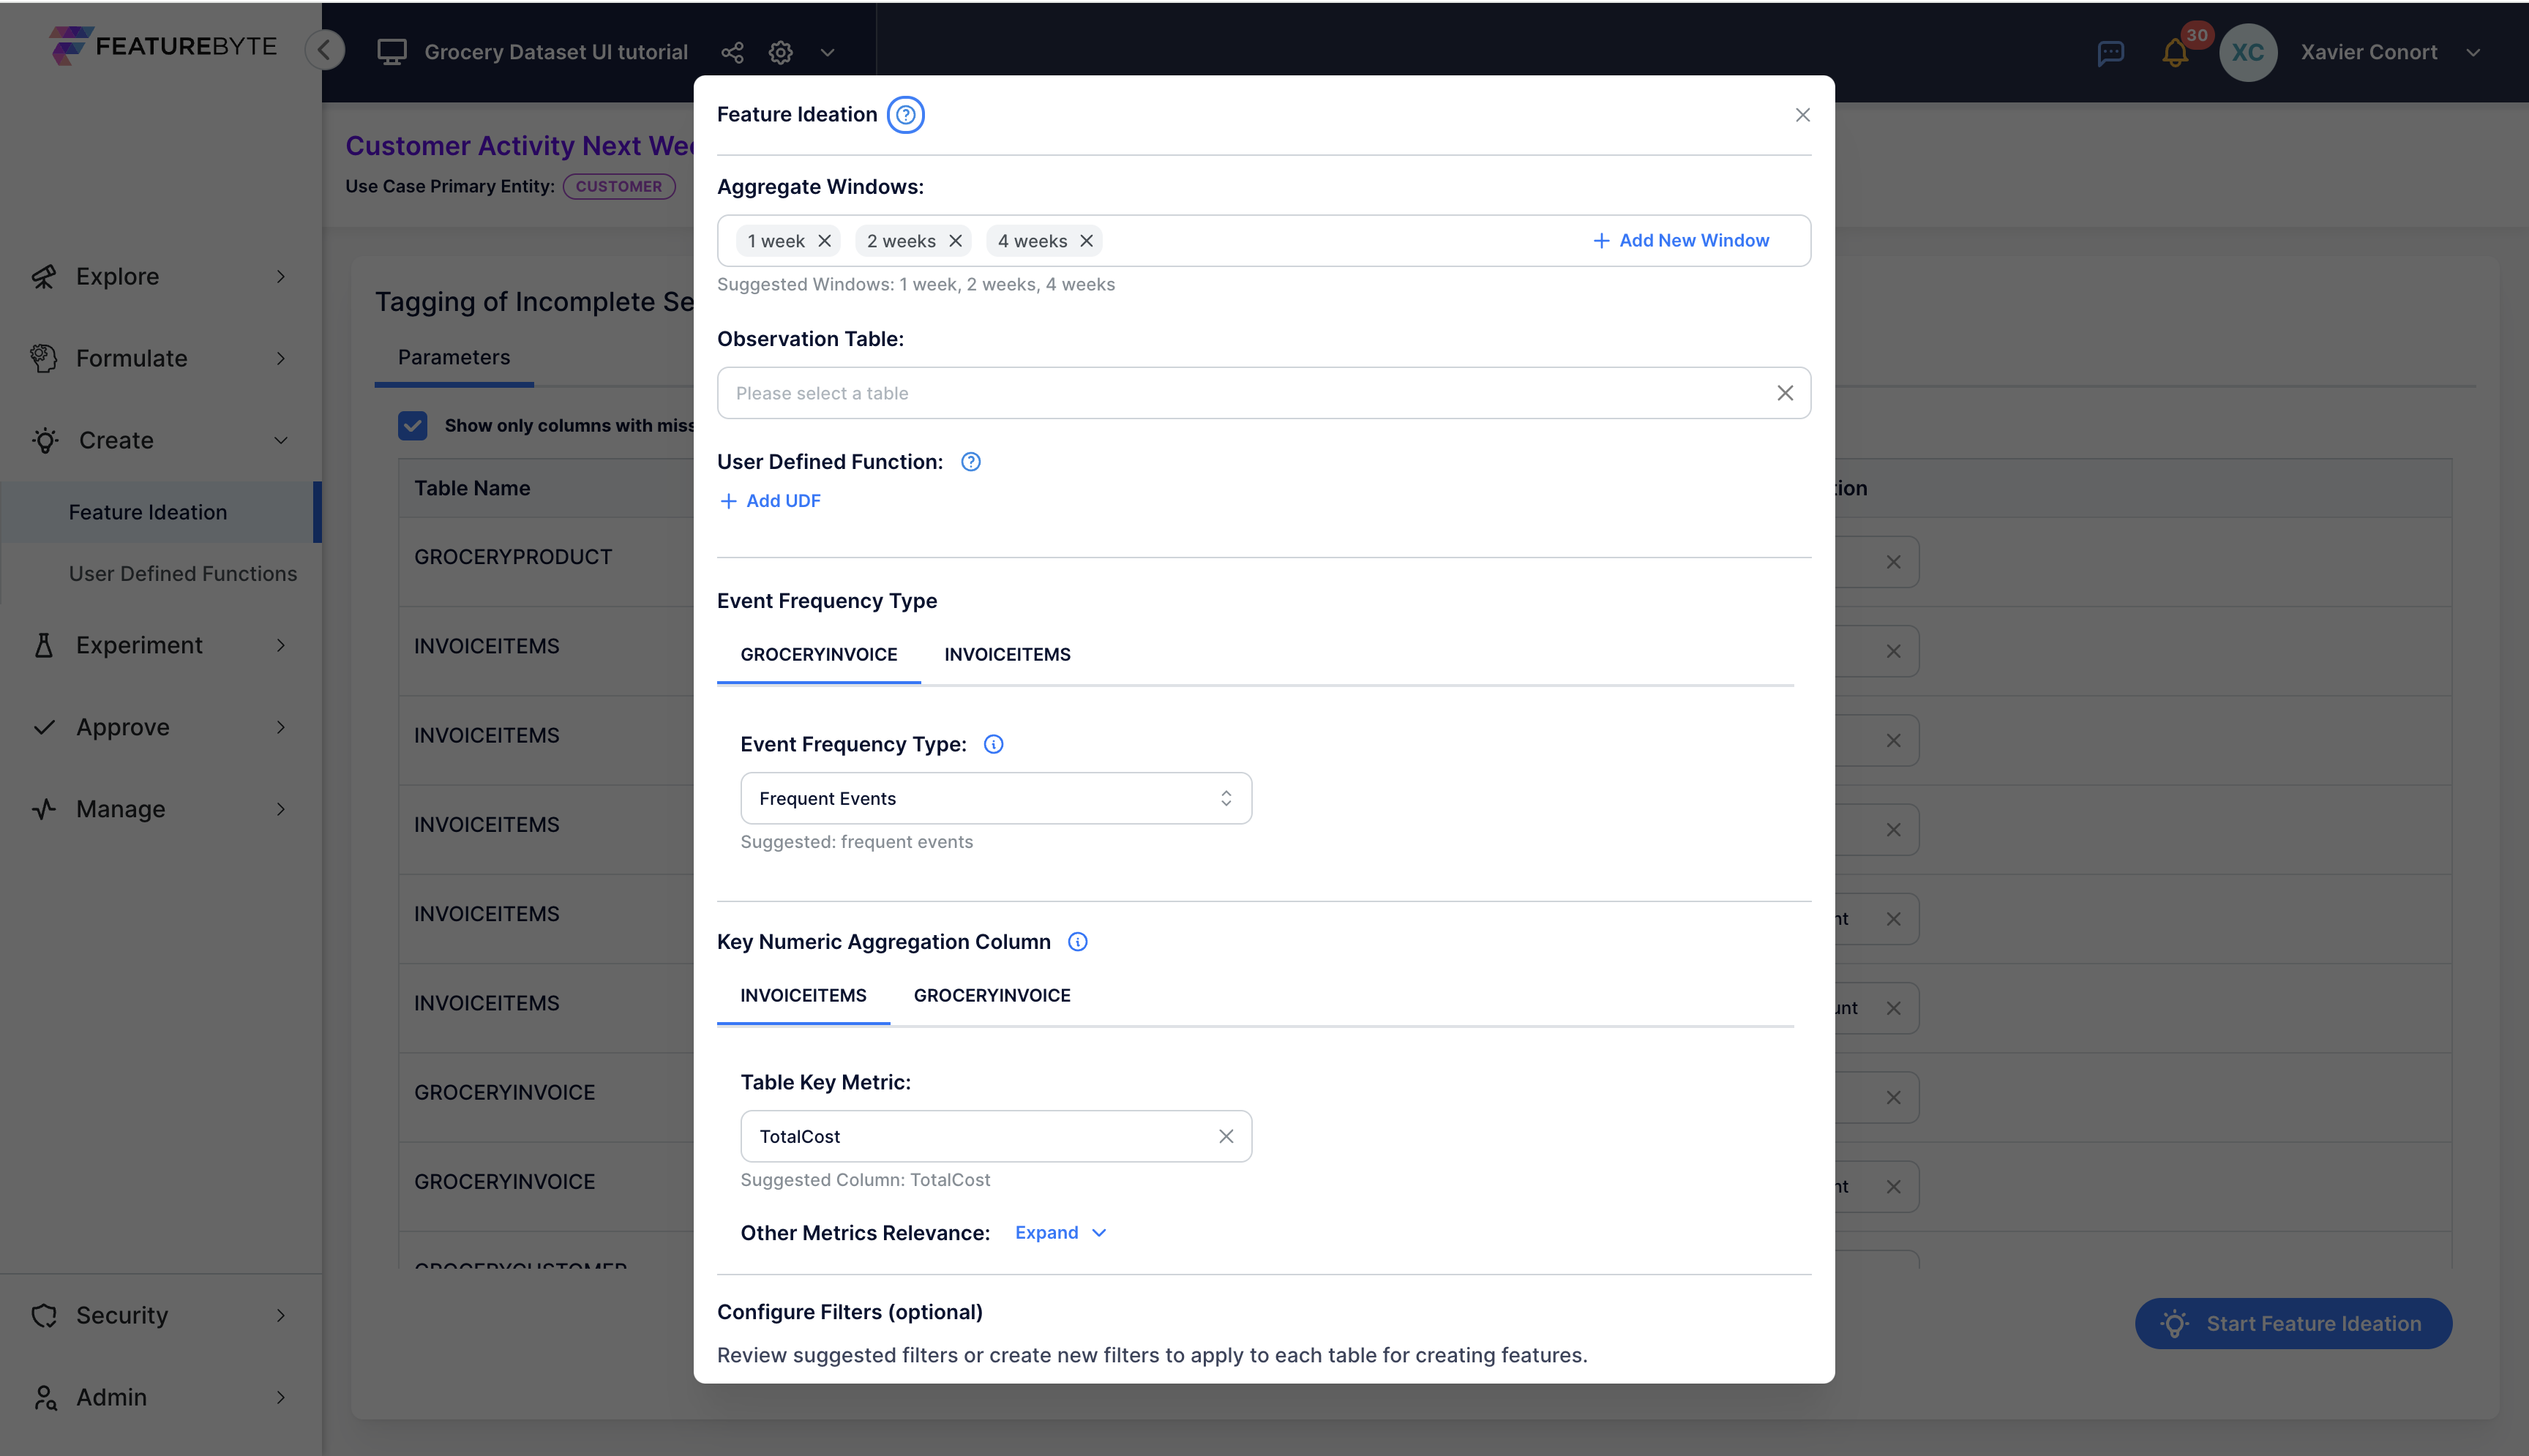
Start by validating the temporal windows. These define the duration for window-based aggregations and also determine offsets for features derived from Slowly Changing Dimension (SCD) tables.
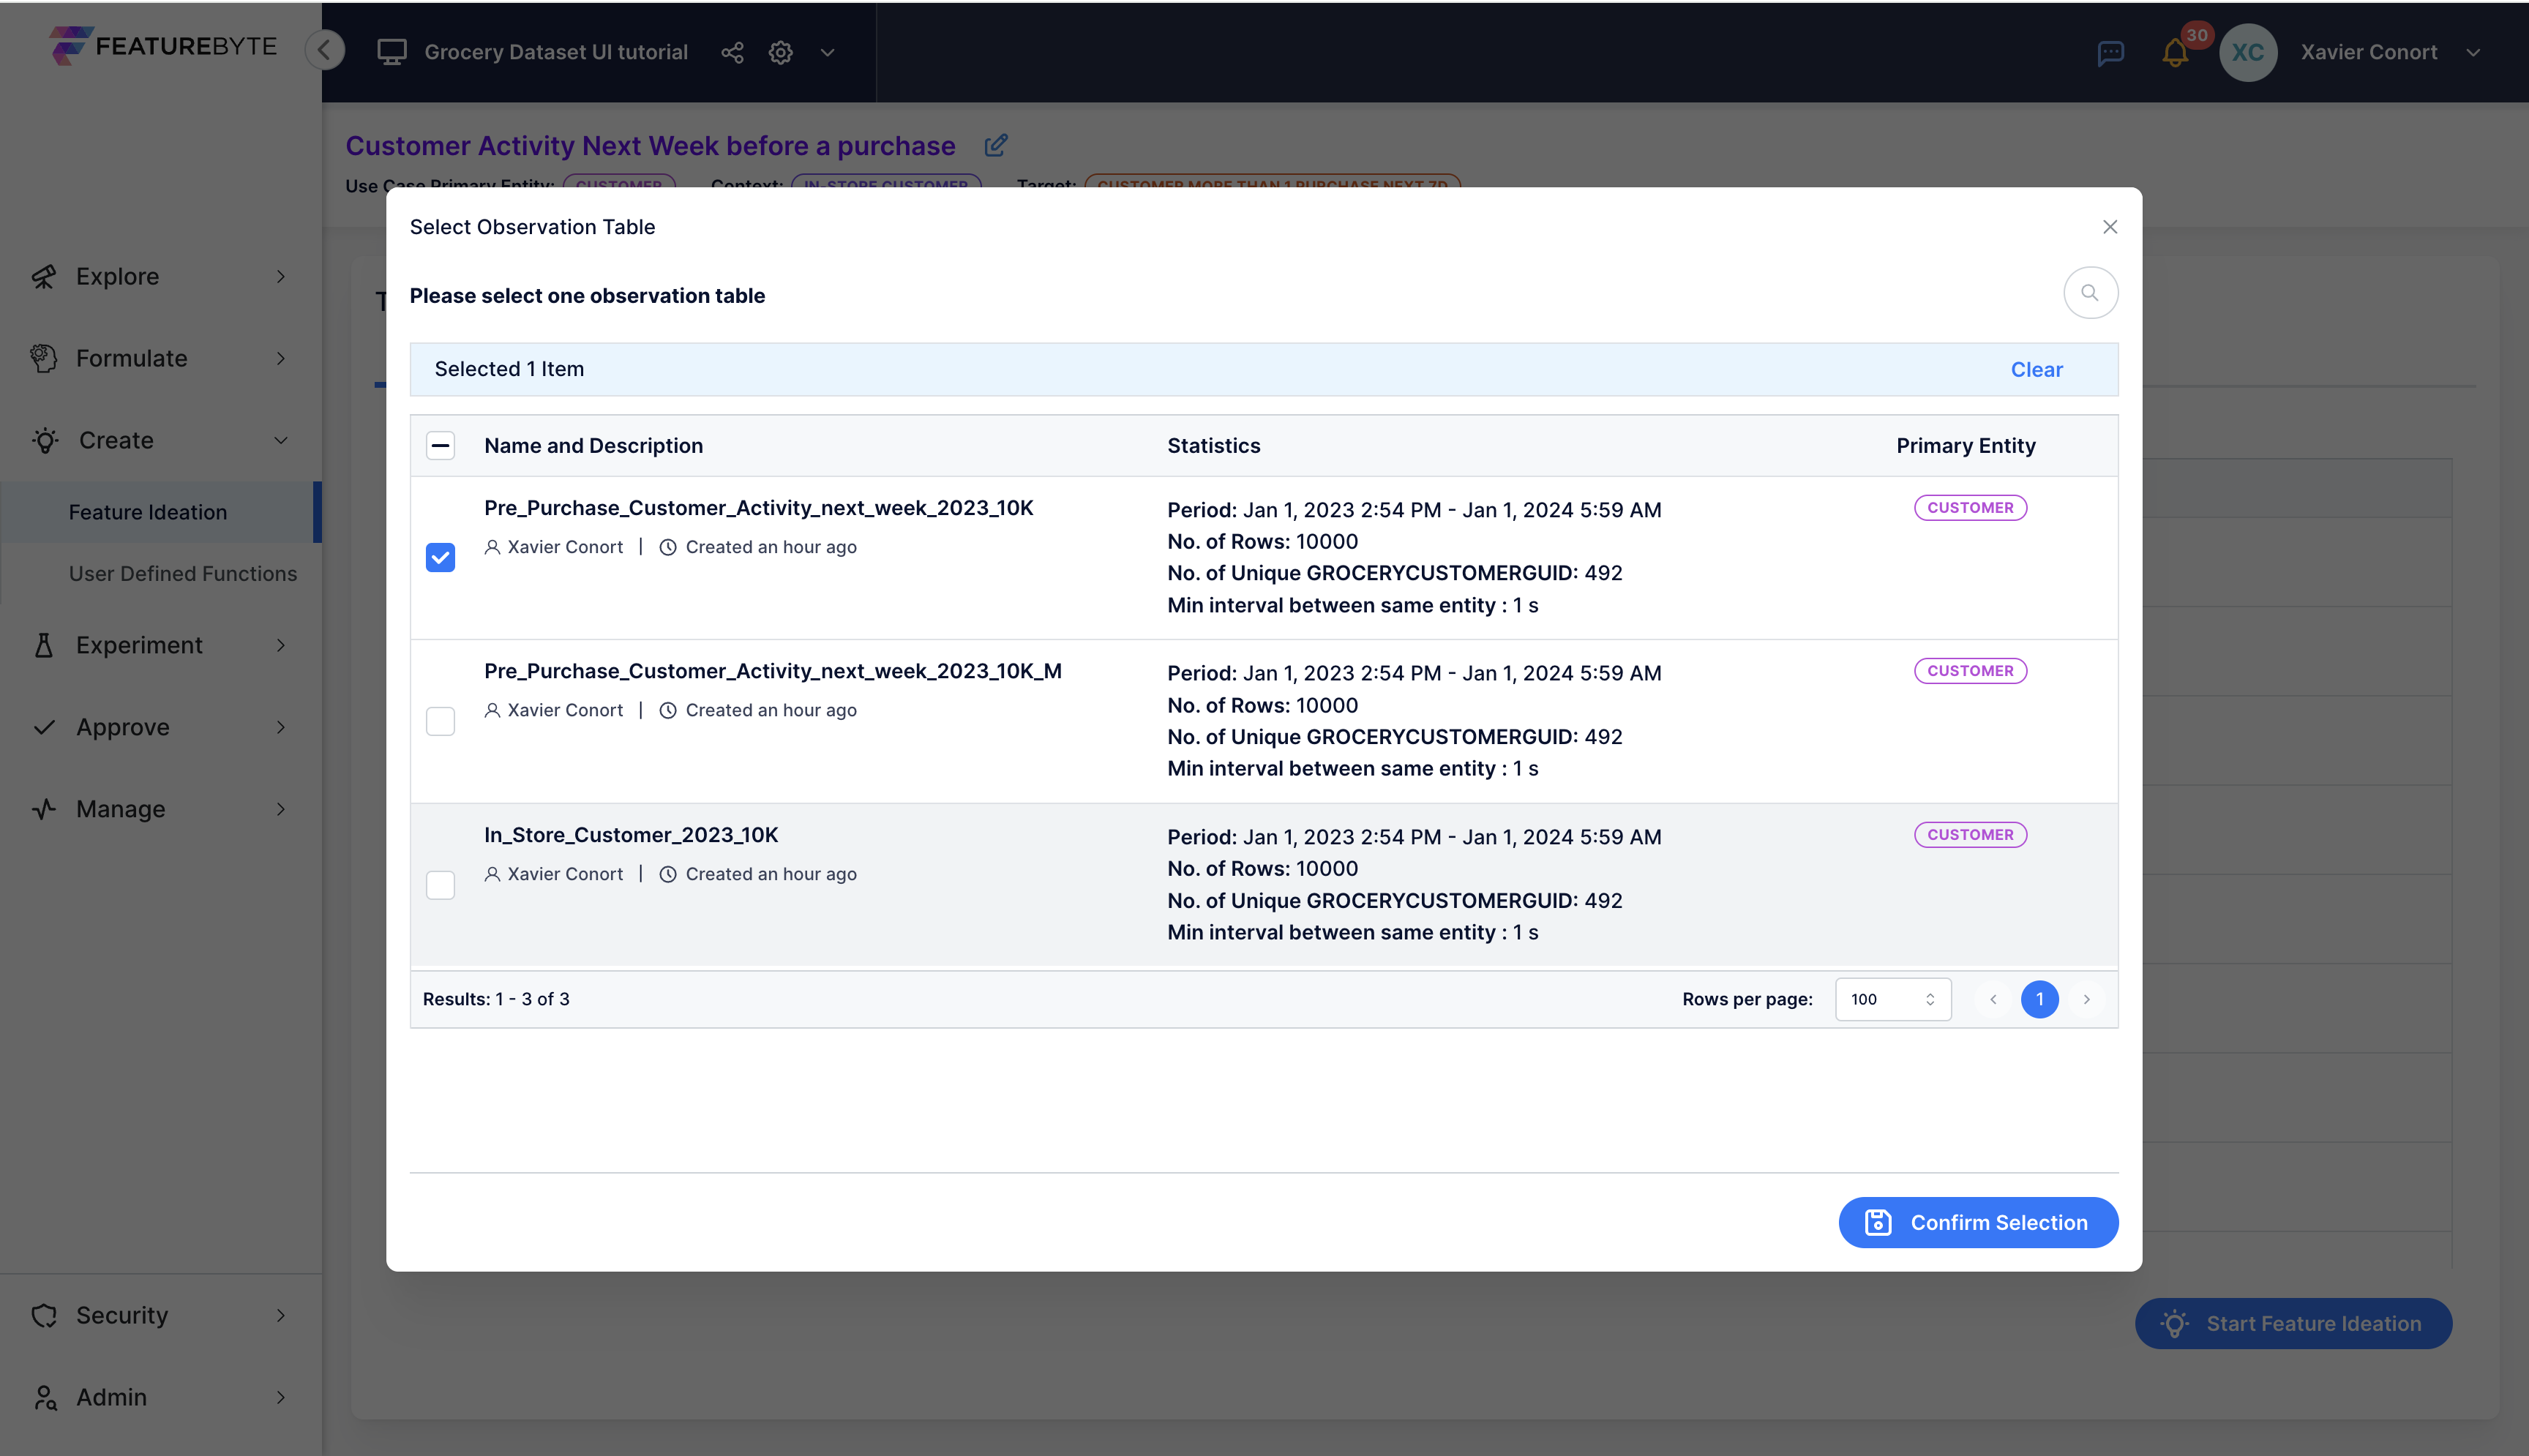
Next, consider selecting an appropriate Observation Table to enhance data evaluation:
- For the use case "Customer Activity Next Week before a purchase," use the "Pre_Purchase_Customer_Activity_next_week_2023_10K" table.
- For the use case "Customer Activity Next Week before a purchase (using the descriptive target)," use the "Pre_Purchase_Customer_Activity_next_week_2023_10K_manual_version" table.
Optionally, incorporate User Defined Functions in your analysis. The application of these functions will be covered in the final section of this tutorial series.
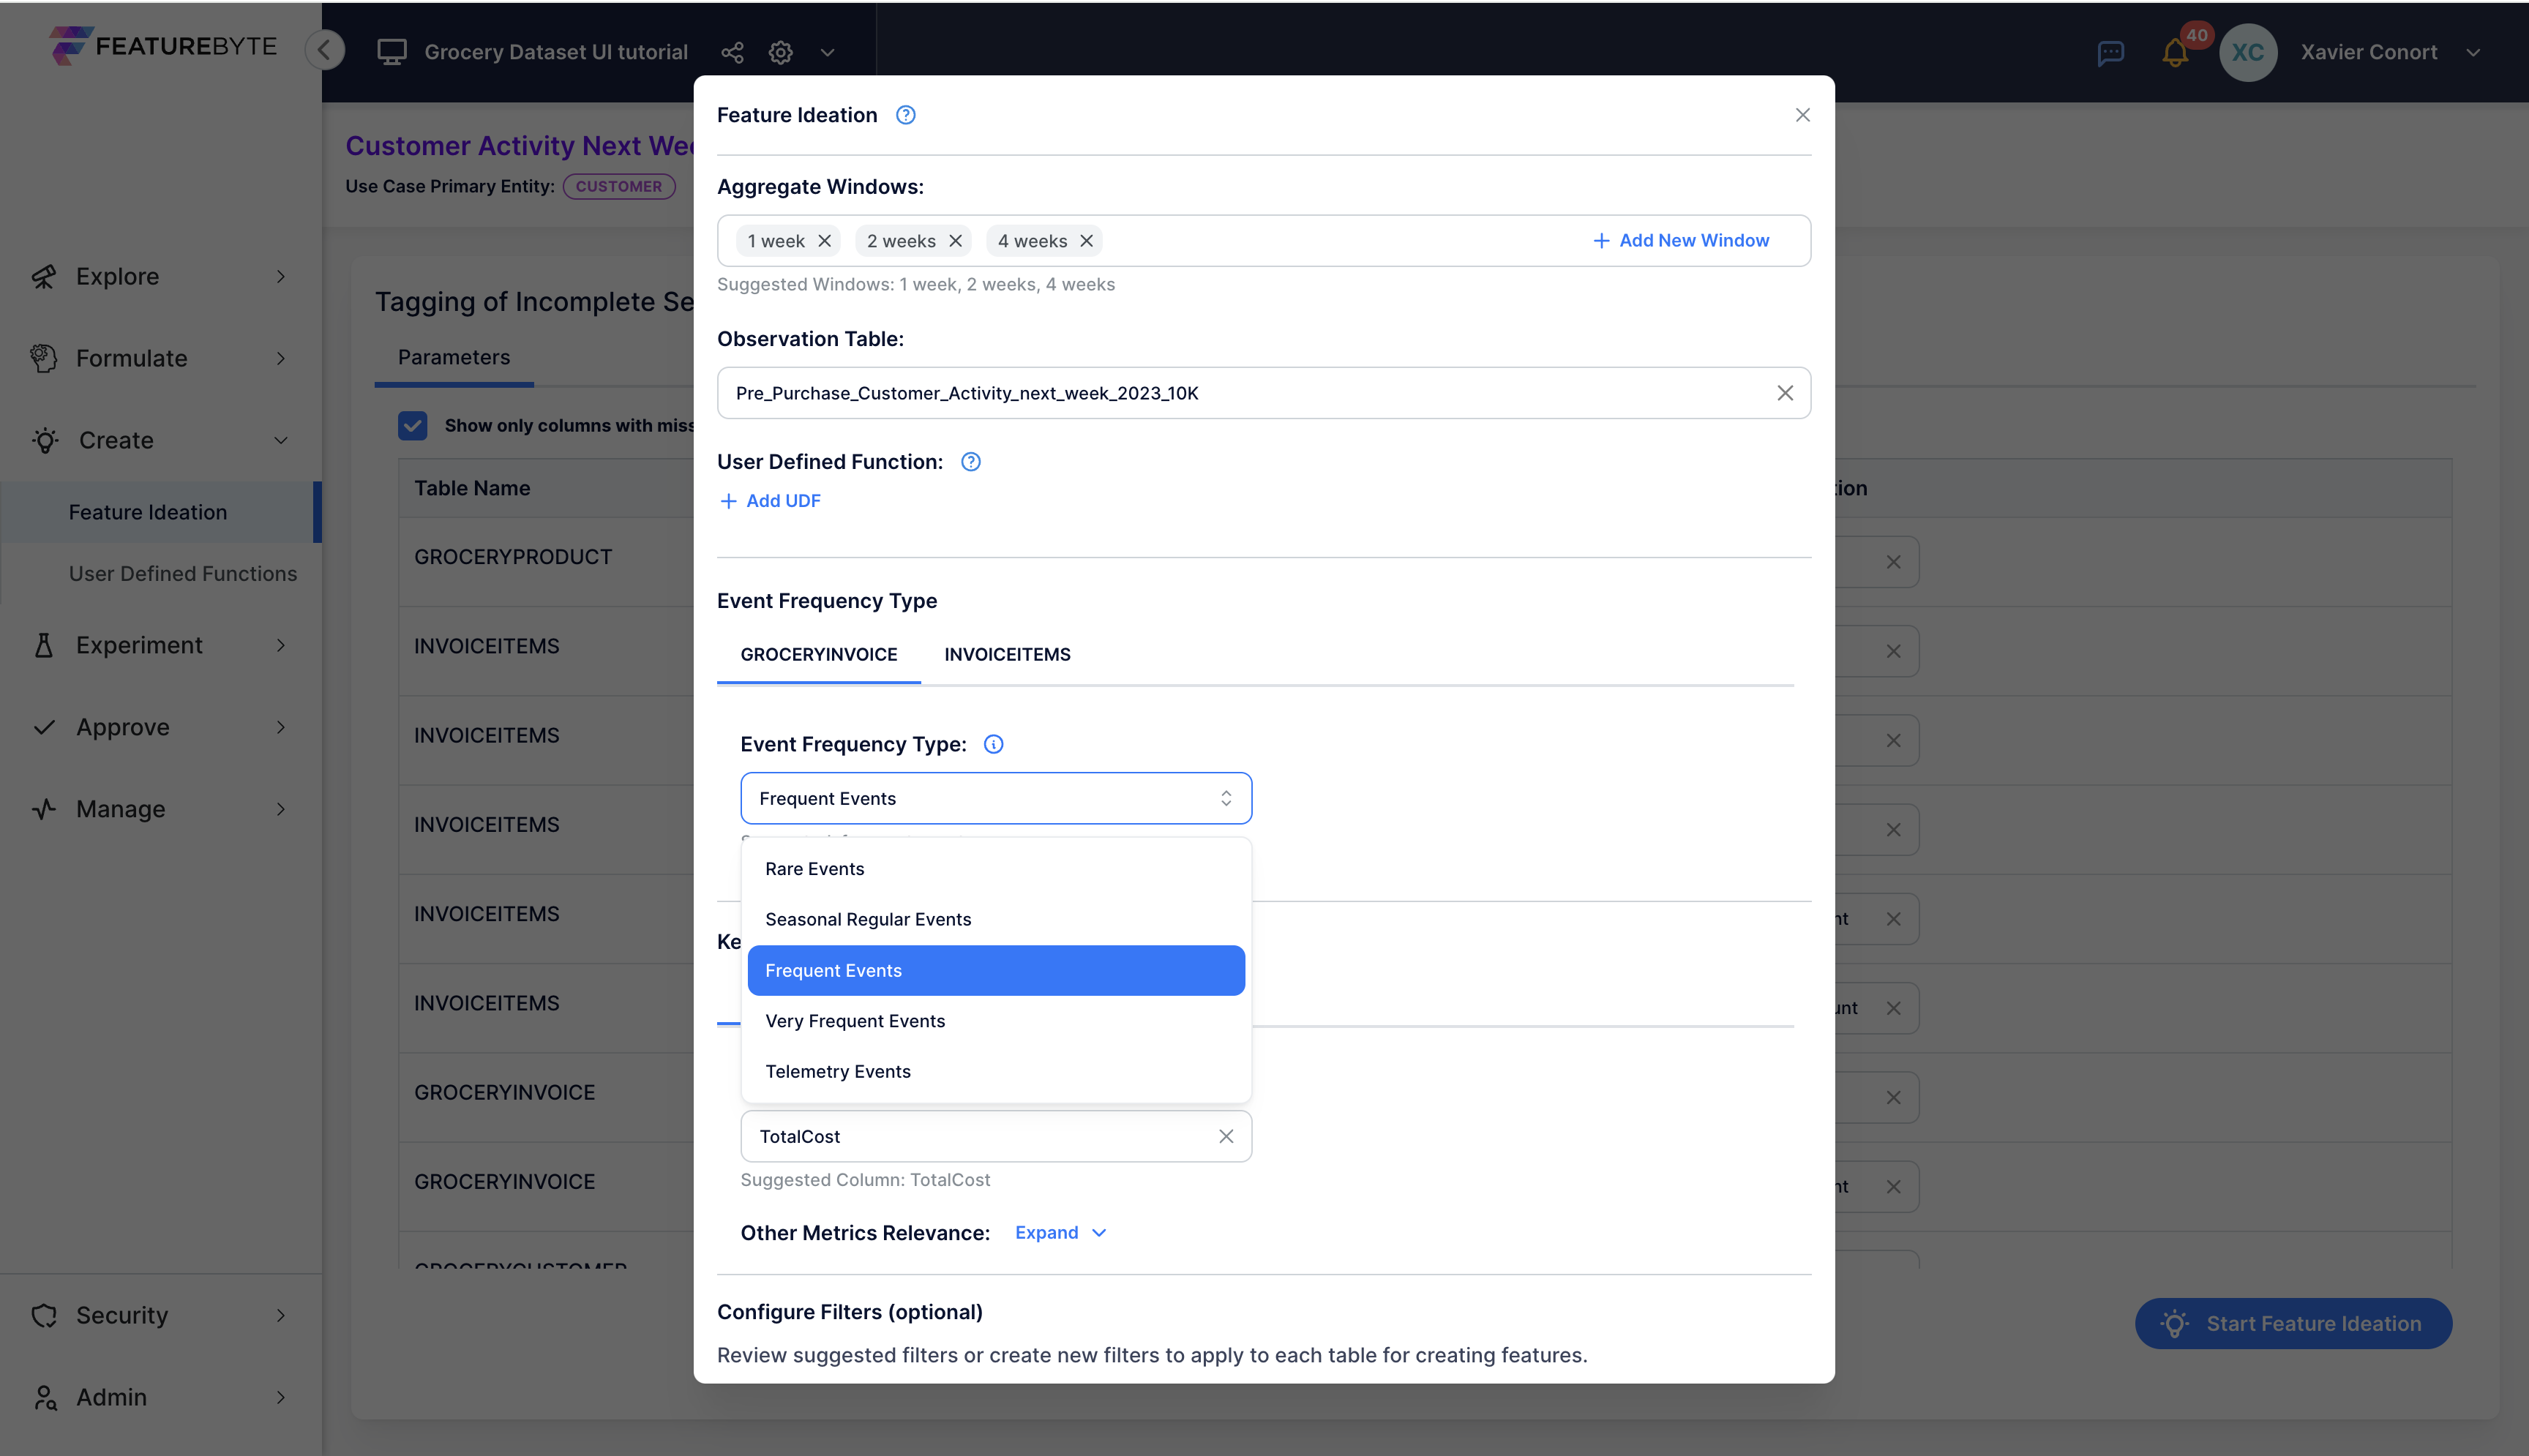
Then, assess the frequency of events for each table. This will determine the date part to extract and the types of features to engineer. Categorize event frequency as:
- Rare Events: Infrequent and unpredictable occurrences.
- Seasonal Regular Events: Regular occurrences tied to specific seasons or periods, happening no more than once per season.
- Frequent Events: Common occurrences, happening several times a week but at irregular intervals.
- Very Frequent Events: Events happening multiple times daily.
- Telemetry Events: High-frequency, regular measurement events.
For our Grocery use case, Copilot suggested Frequent Events.
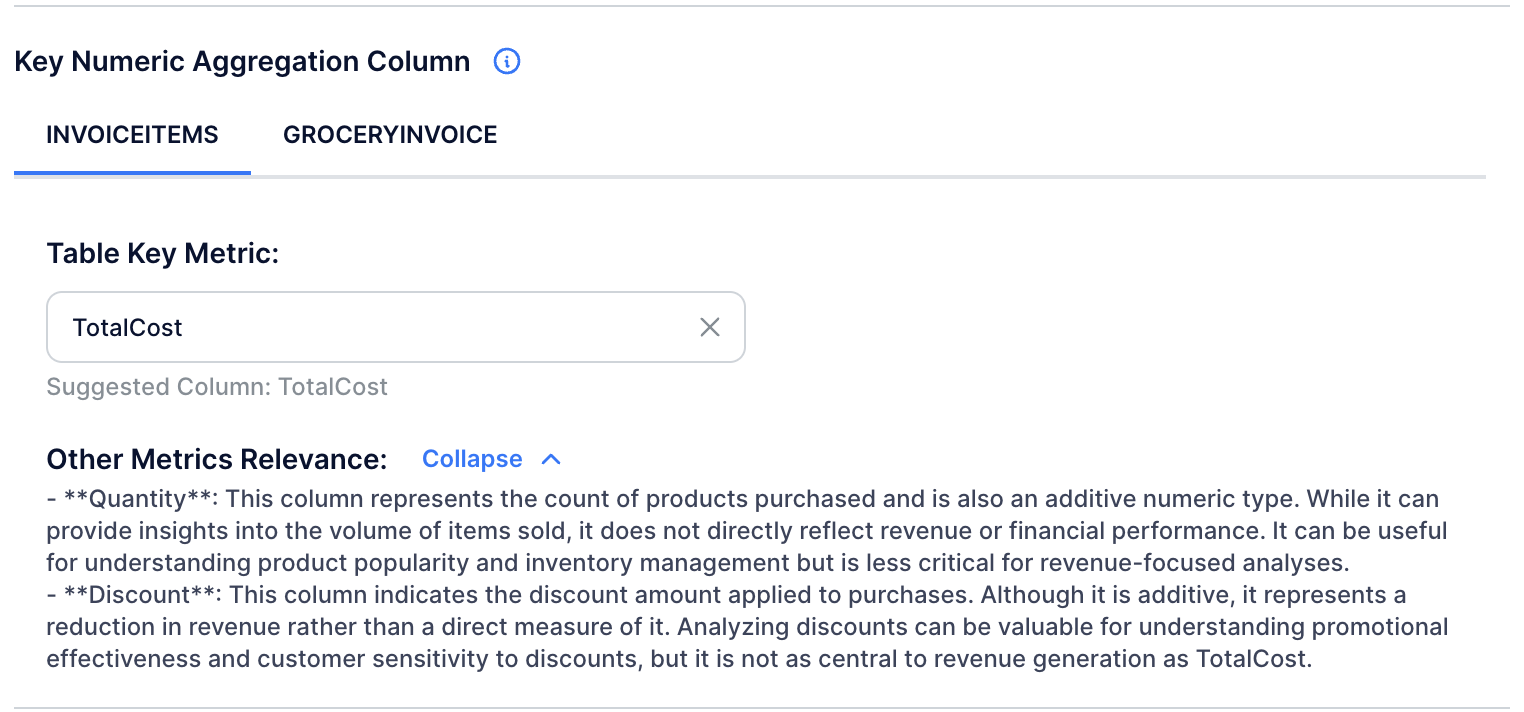
Afterwards, verify the key numeric aggregation column for each table. This column, combined with categorical data like Product Group or Weekday, enables analysis of value distribution across different categories to create "bucketed" features.
For the 'INVOICEITEMS' table, 'TotalCost' is recommended as the key column. A resulting feature might be the Customer's Sum of TotalCost per Product Group over the past 2 weeks, reflecting the monetary value of their basket. This feature may be used to form other features to provide insights into purchase patterns, basket diversity, and spending habits within product groups. Additionally, this feature can be converted into a sparse matrix for modeling purposes.
Finally, although Copilot does not recommend specific filters for our dataset due to the lack of event types or statuses, its filtering capabilities are still accessible for exploring potential features. In the final section of this tutorial series, we will employ these filters to unearth features that concentrate on specific subsets of the customer's basket.
Note
Filtering is crucial when columns like "event type" and "event status" exist, such as in Credit Card Transactions with identifiers for transaction types (e.g., "Purchase", "Cash Advance", "Reversal") and statuses (e.g., "Authorized", "Rejected", "Cancelled"). In such scenarios, Copilot will recommend relevant filters for the specific use case.
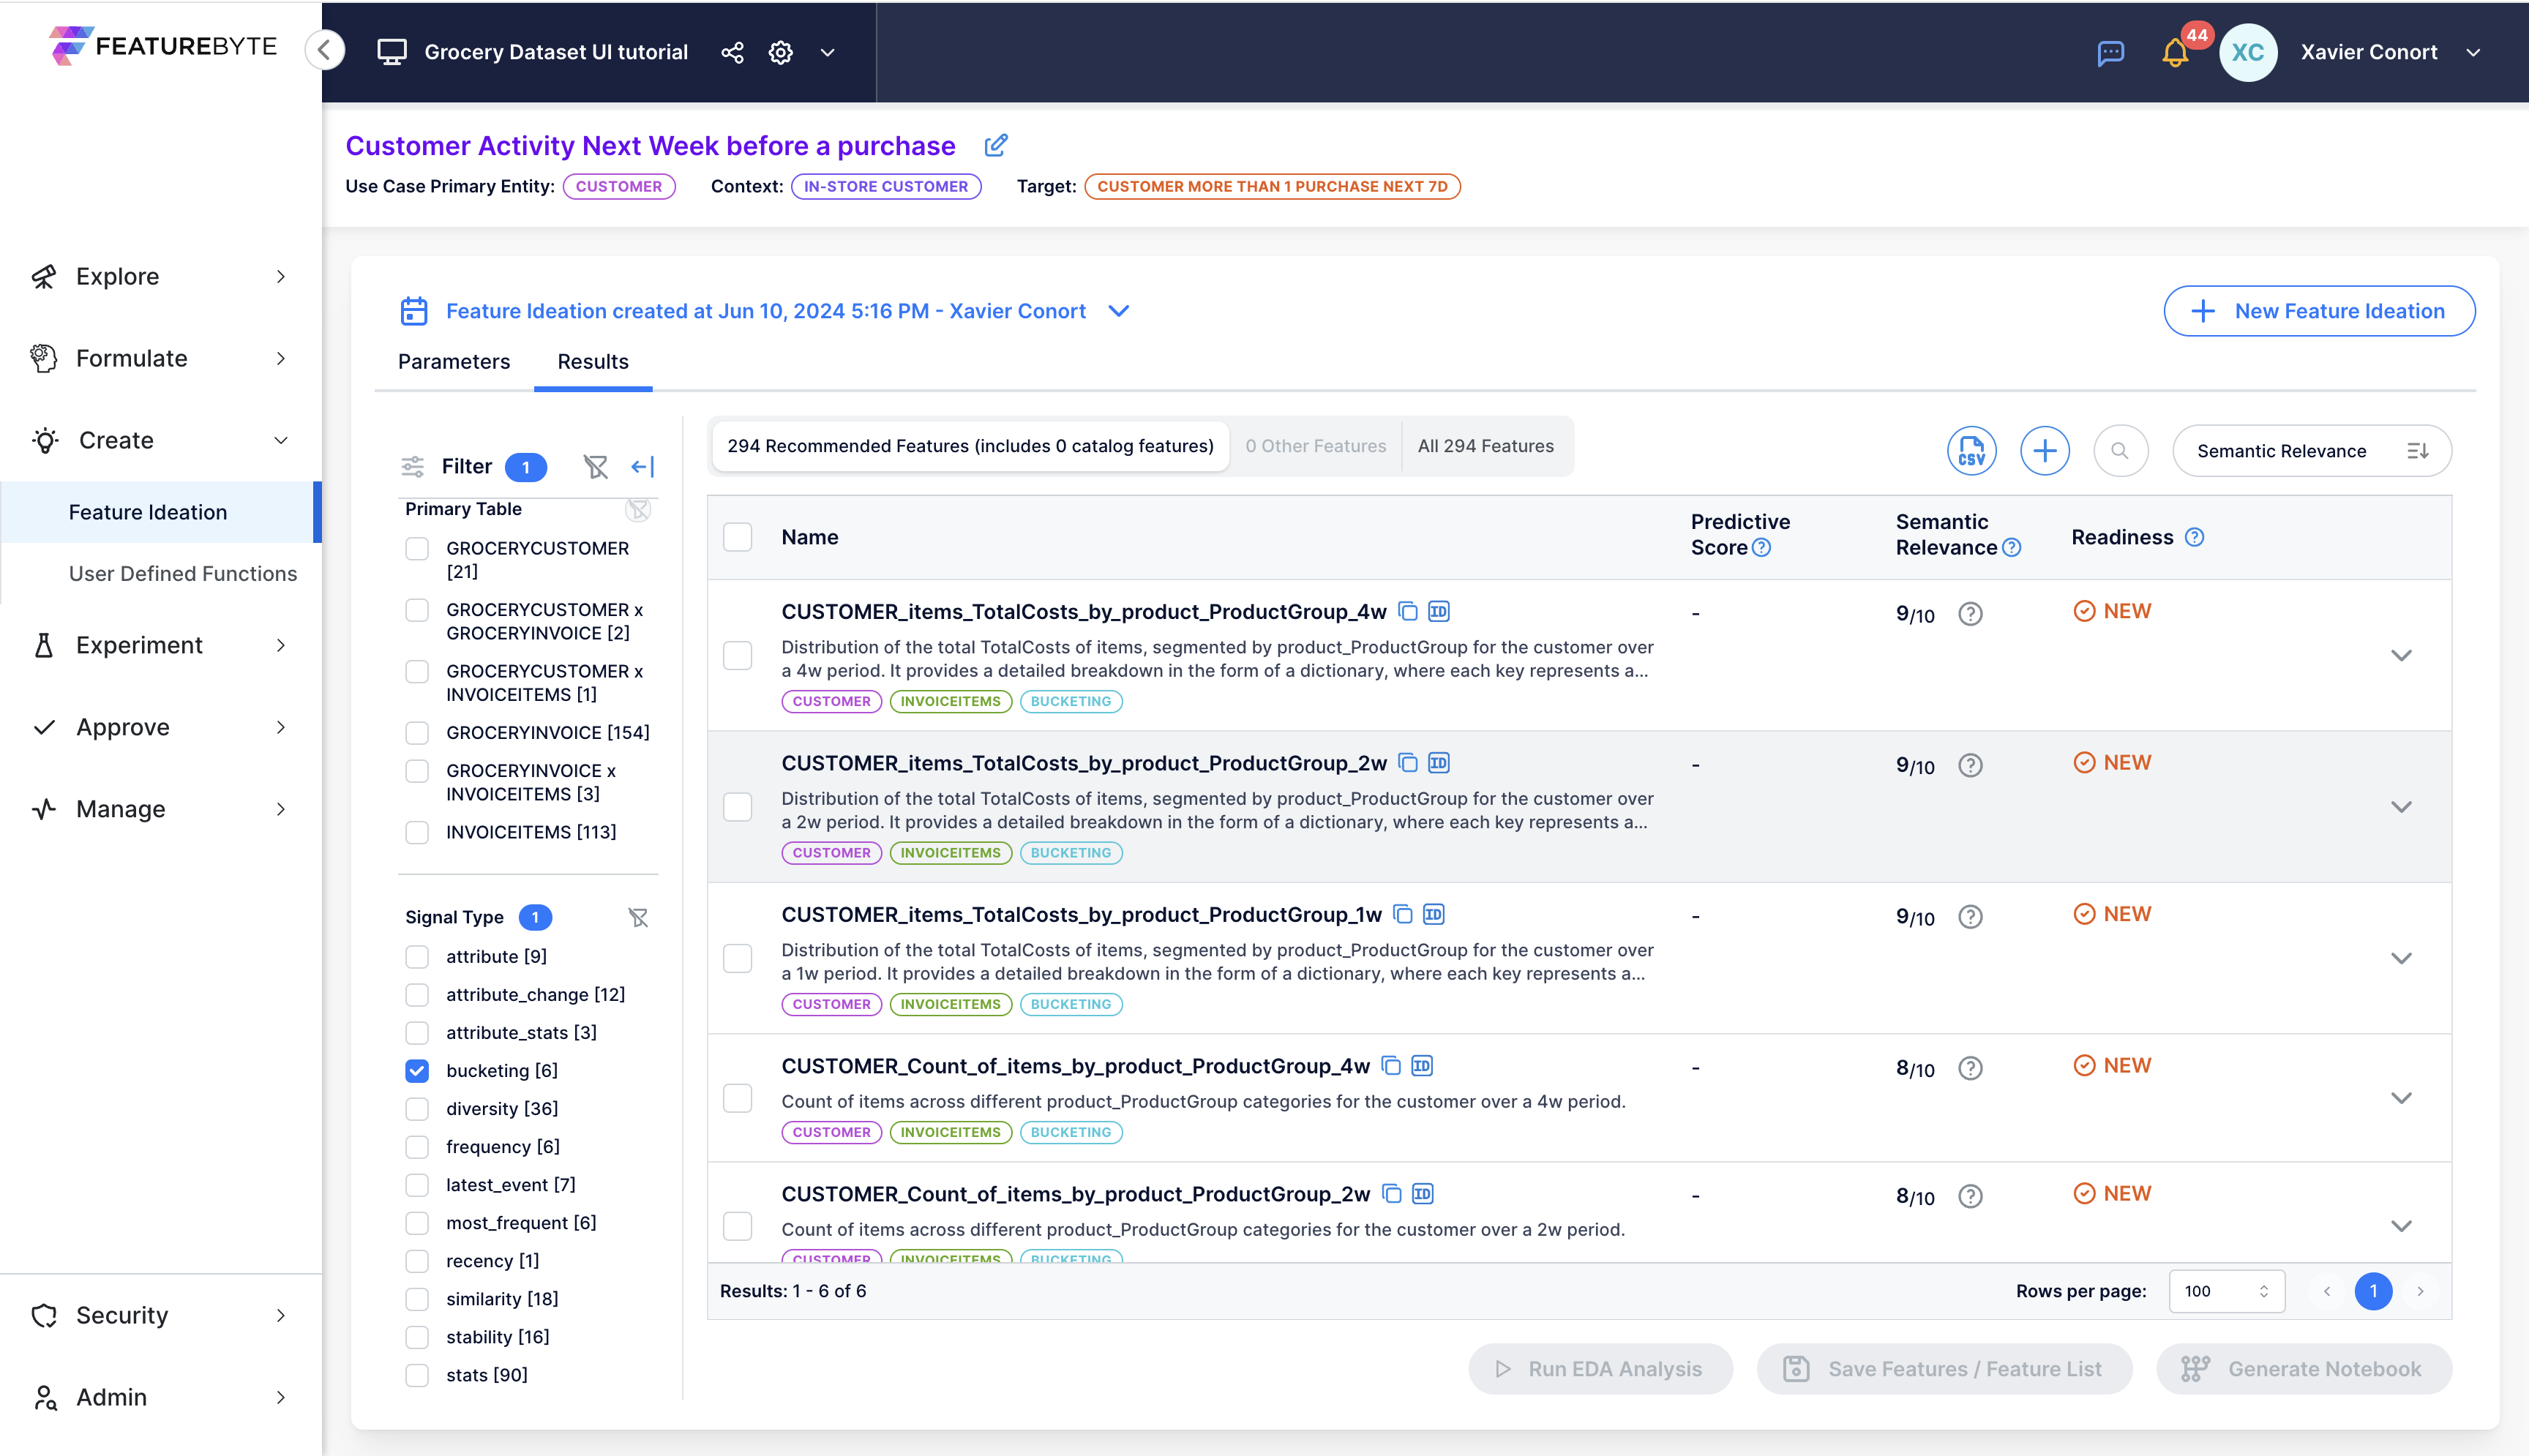
Step 5: Get Automated Feature Suggestions
Click  to initiate the feature search.
Explore the suggested features, with newly proposed ones marked as "New" in the "Readiness" column. Features already present in the Feature Catalog will display their readiness status as either "Draft," "Public Draft," or "Production Ready."
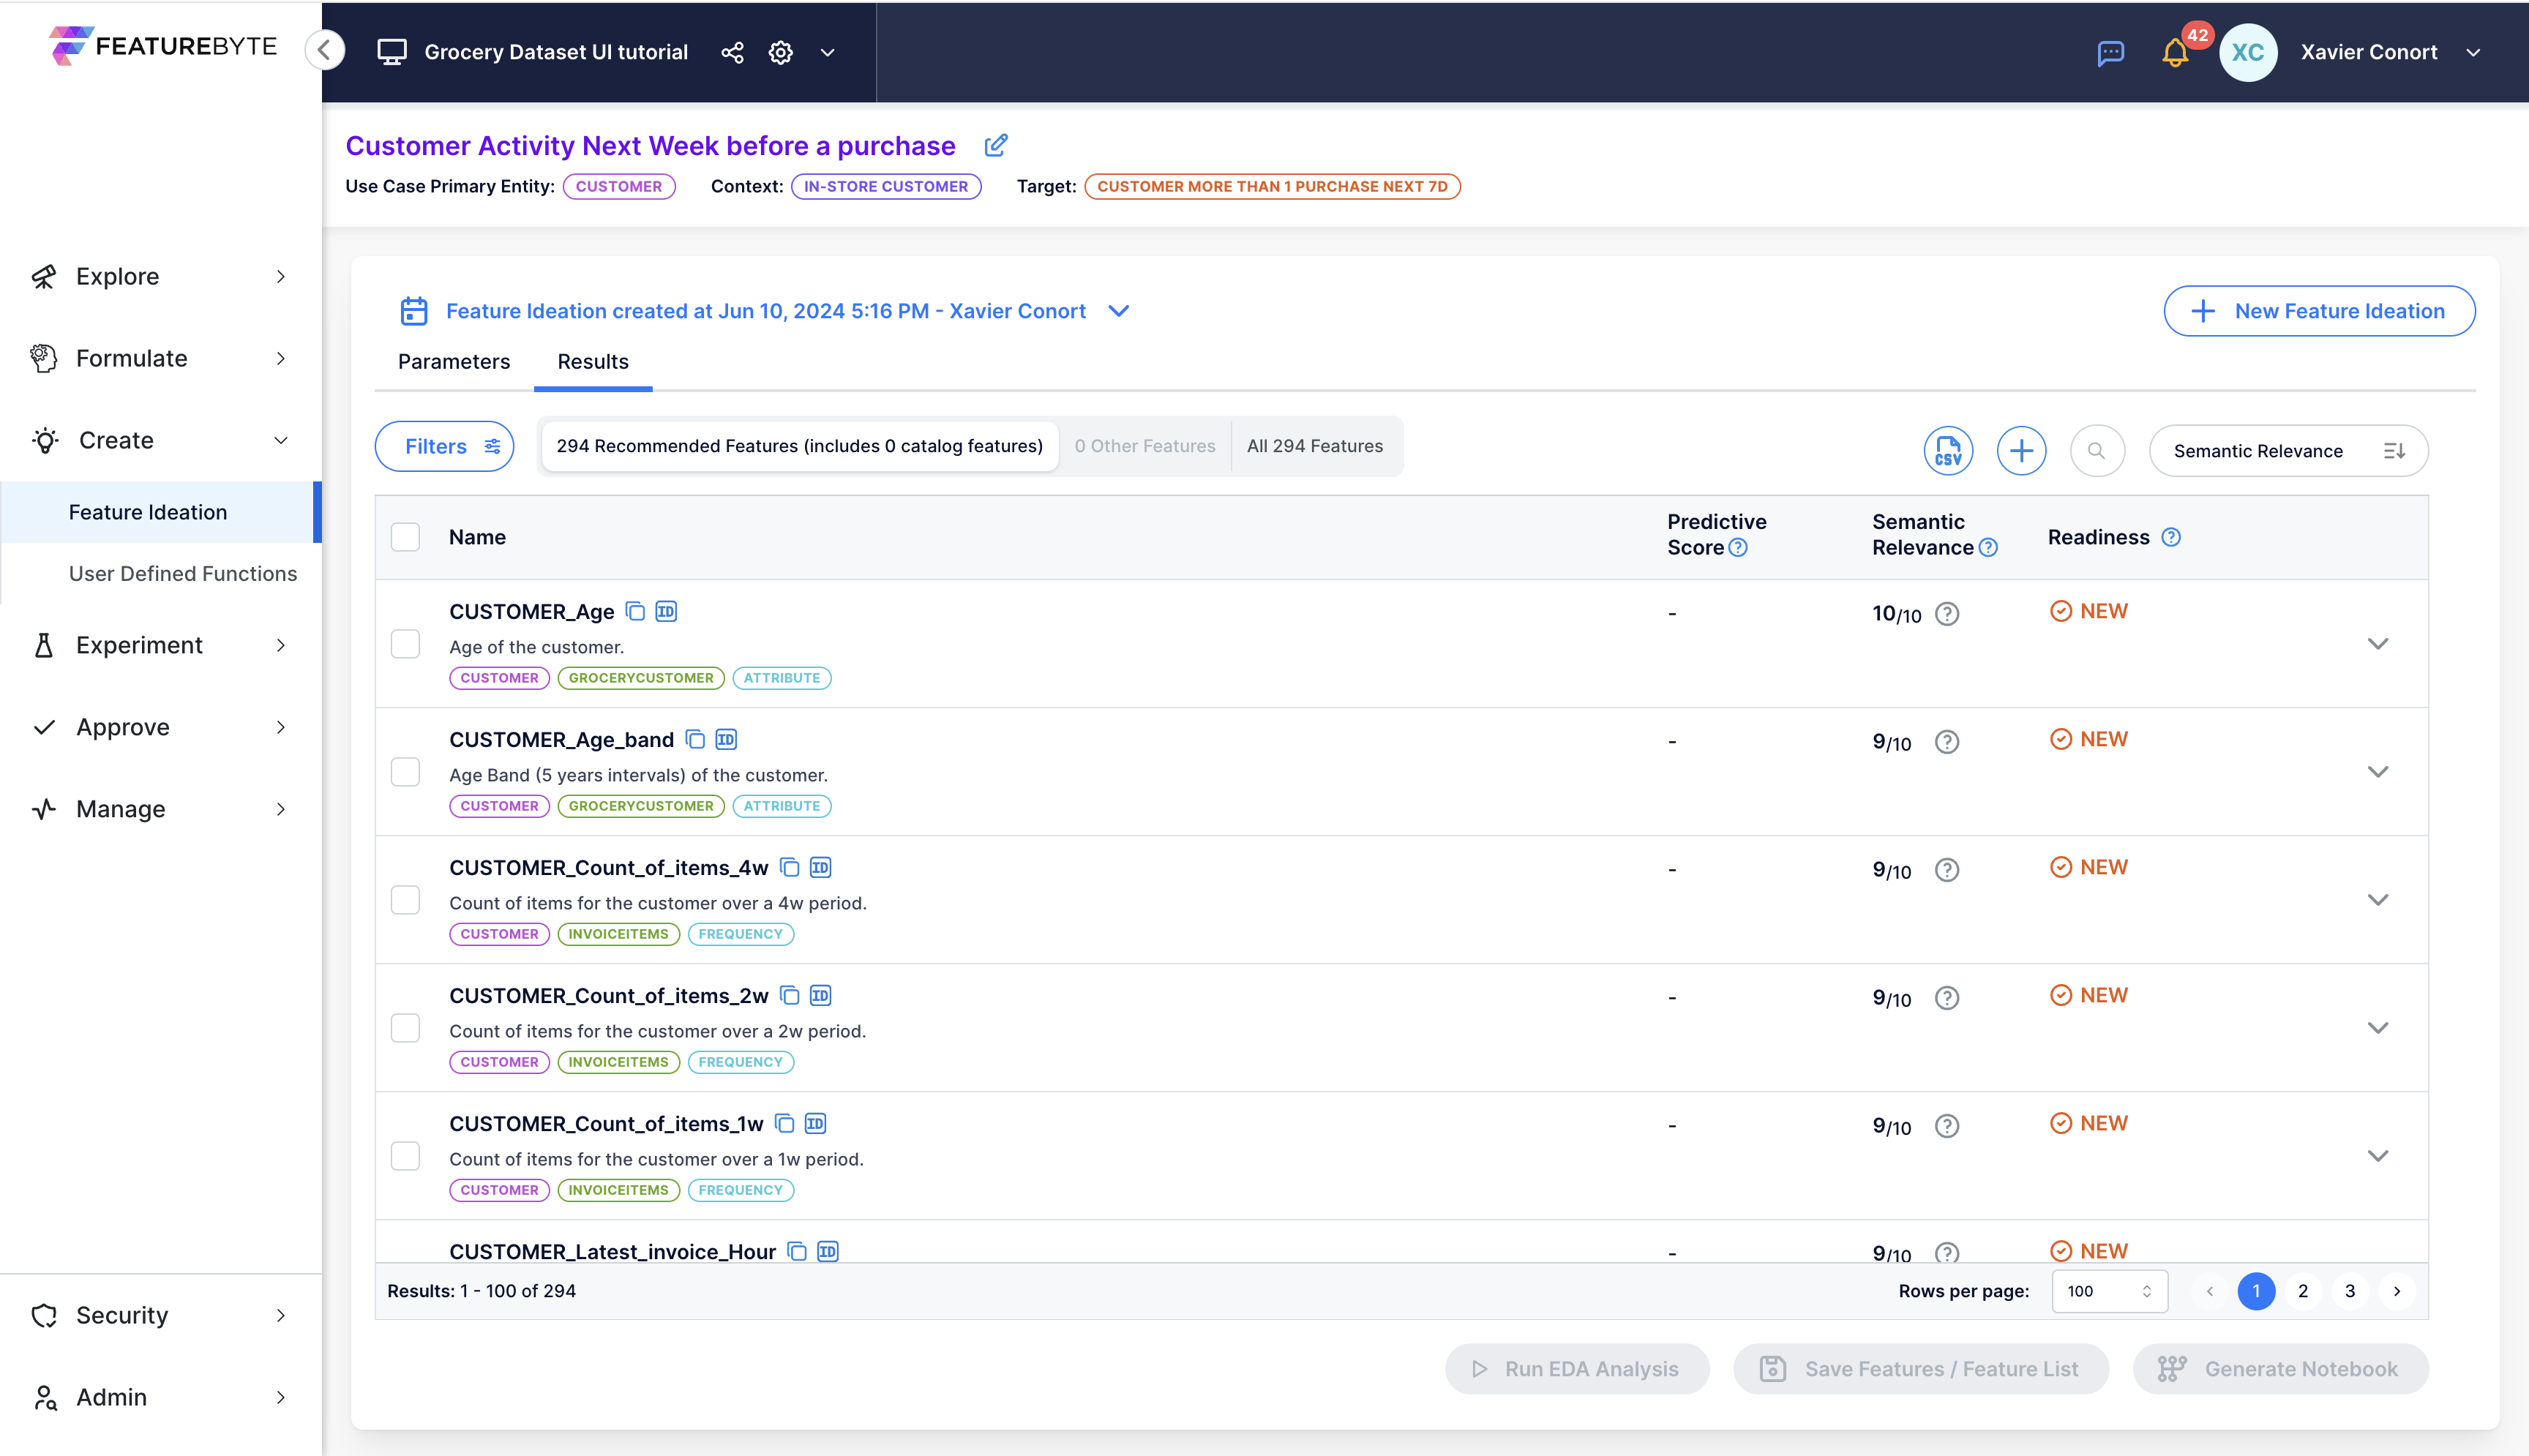
Features are sorted by default based on two criteria: semantic relevance scores and complexity.
Semantic relevance scores, derived from Generative AI, evaluate each feature's significance within the specified use case. This metric complements statistical relevance by ensuring features not only demonstrate high correlation with the target variable but also carry contextual meaning.
Additionally, each feature is systematically categorized by its primary entity, primary table, and signal type, streamlining feature exploration.
To further enhance this analysis, we'll delve into computing predictive scores for each feature on demand.
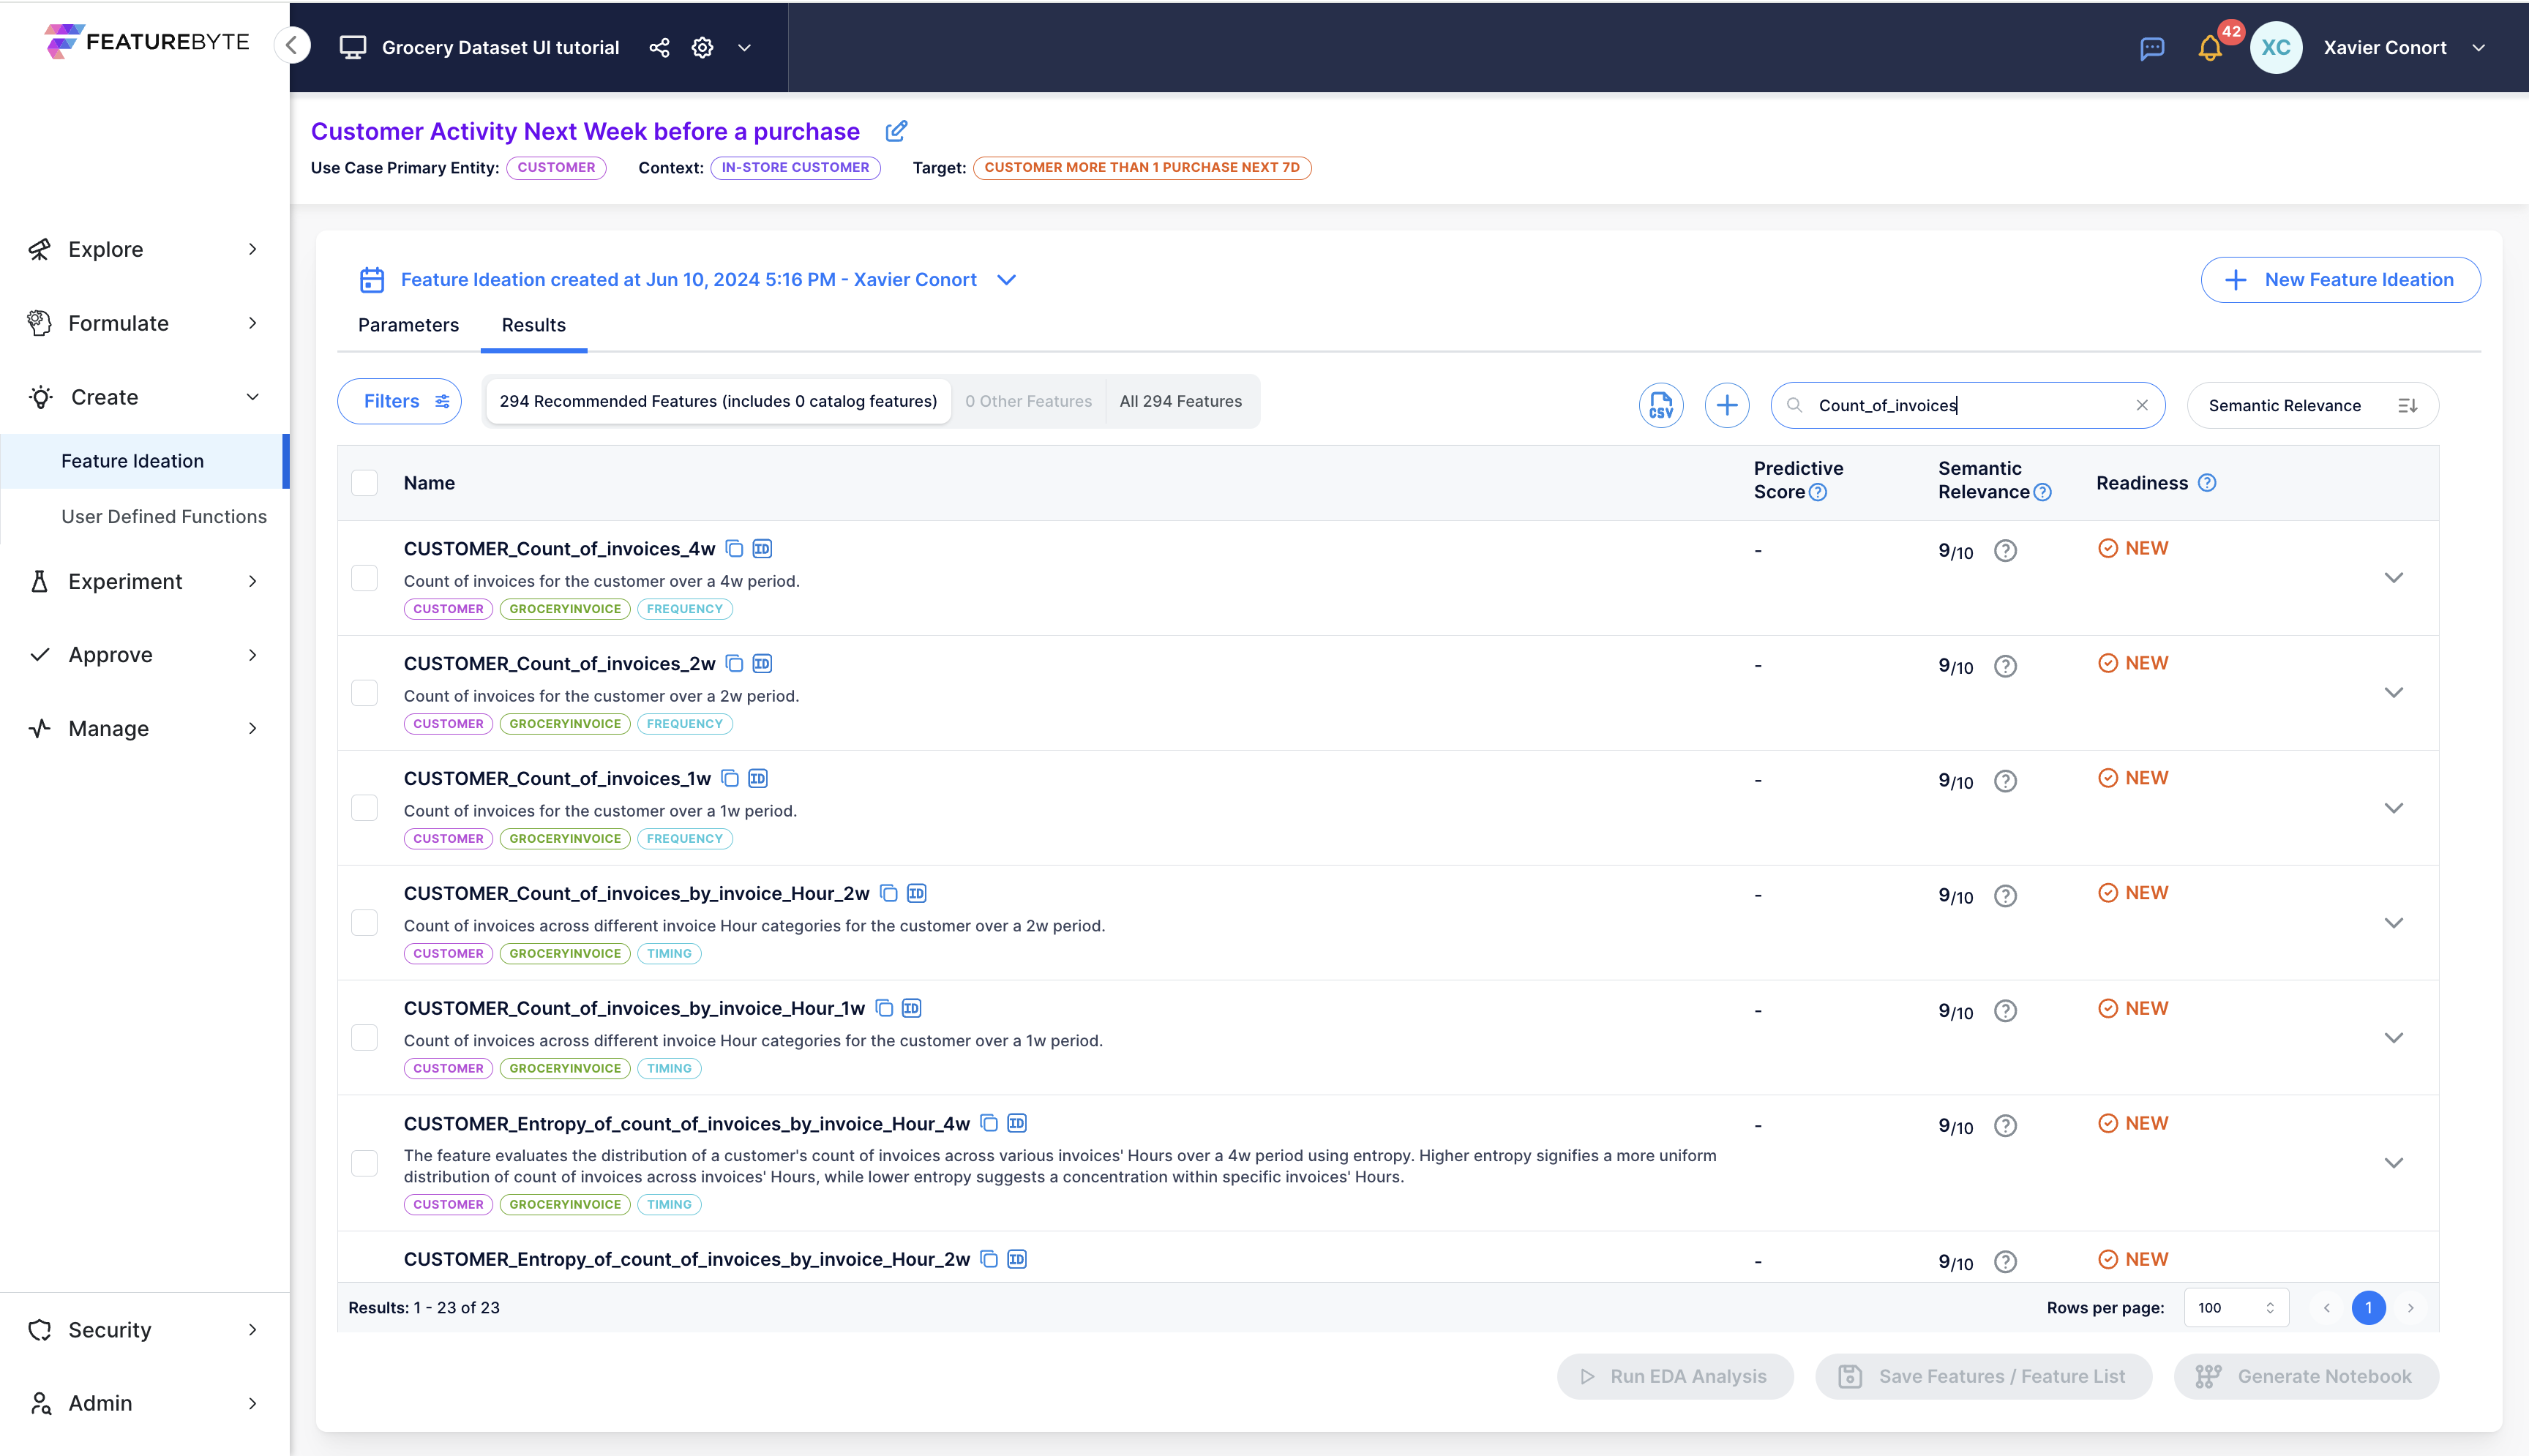
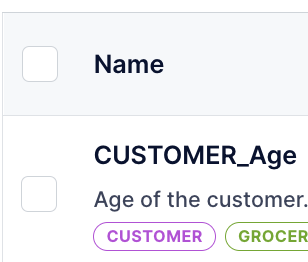
Step 6: Review specific feature details
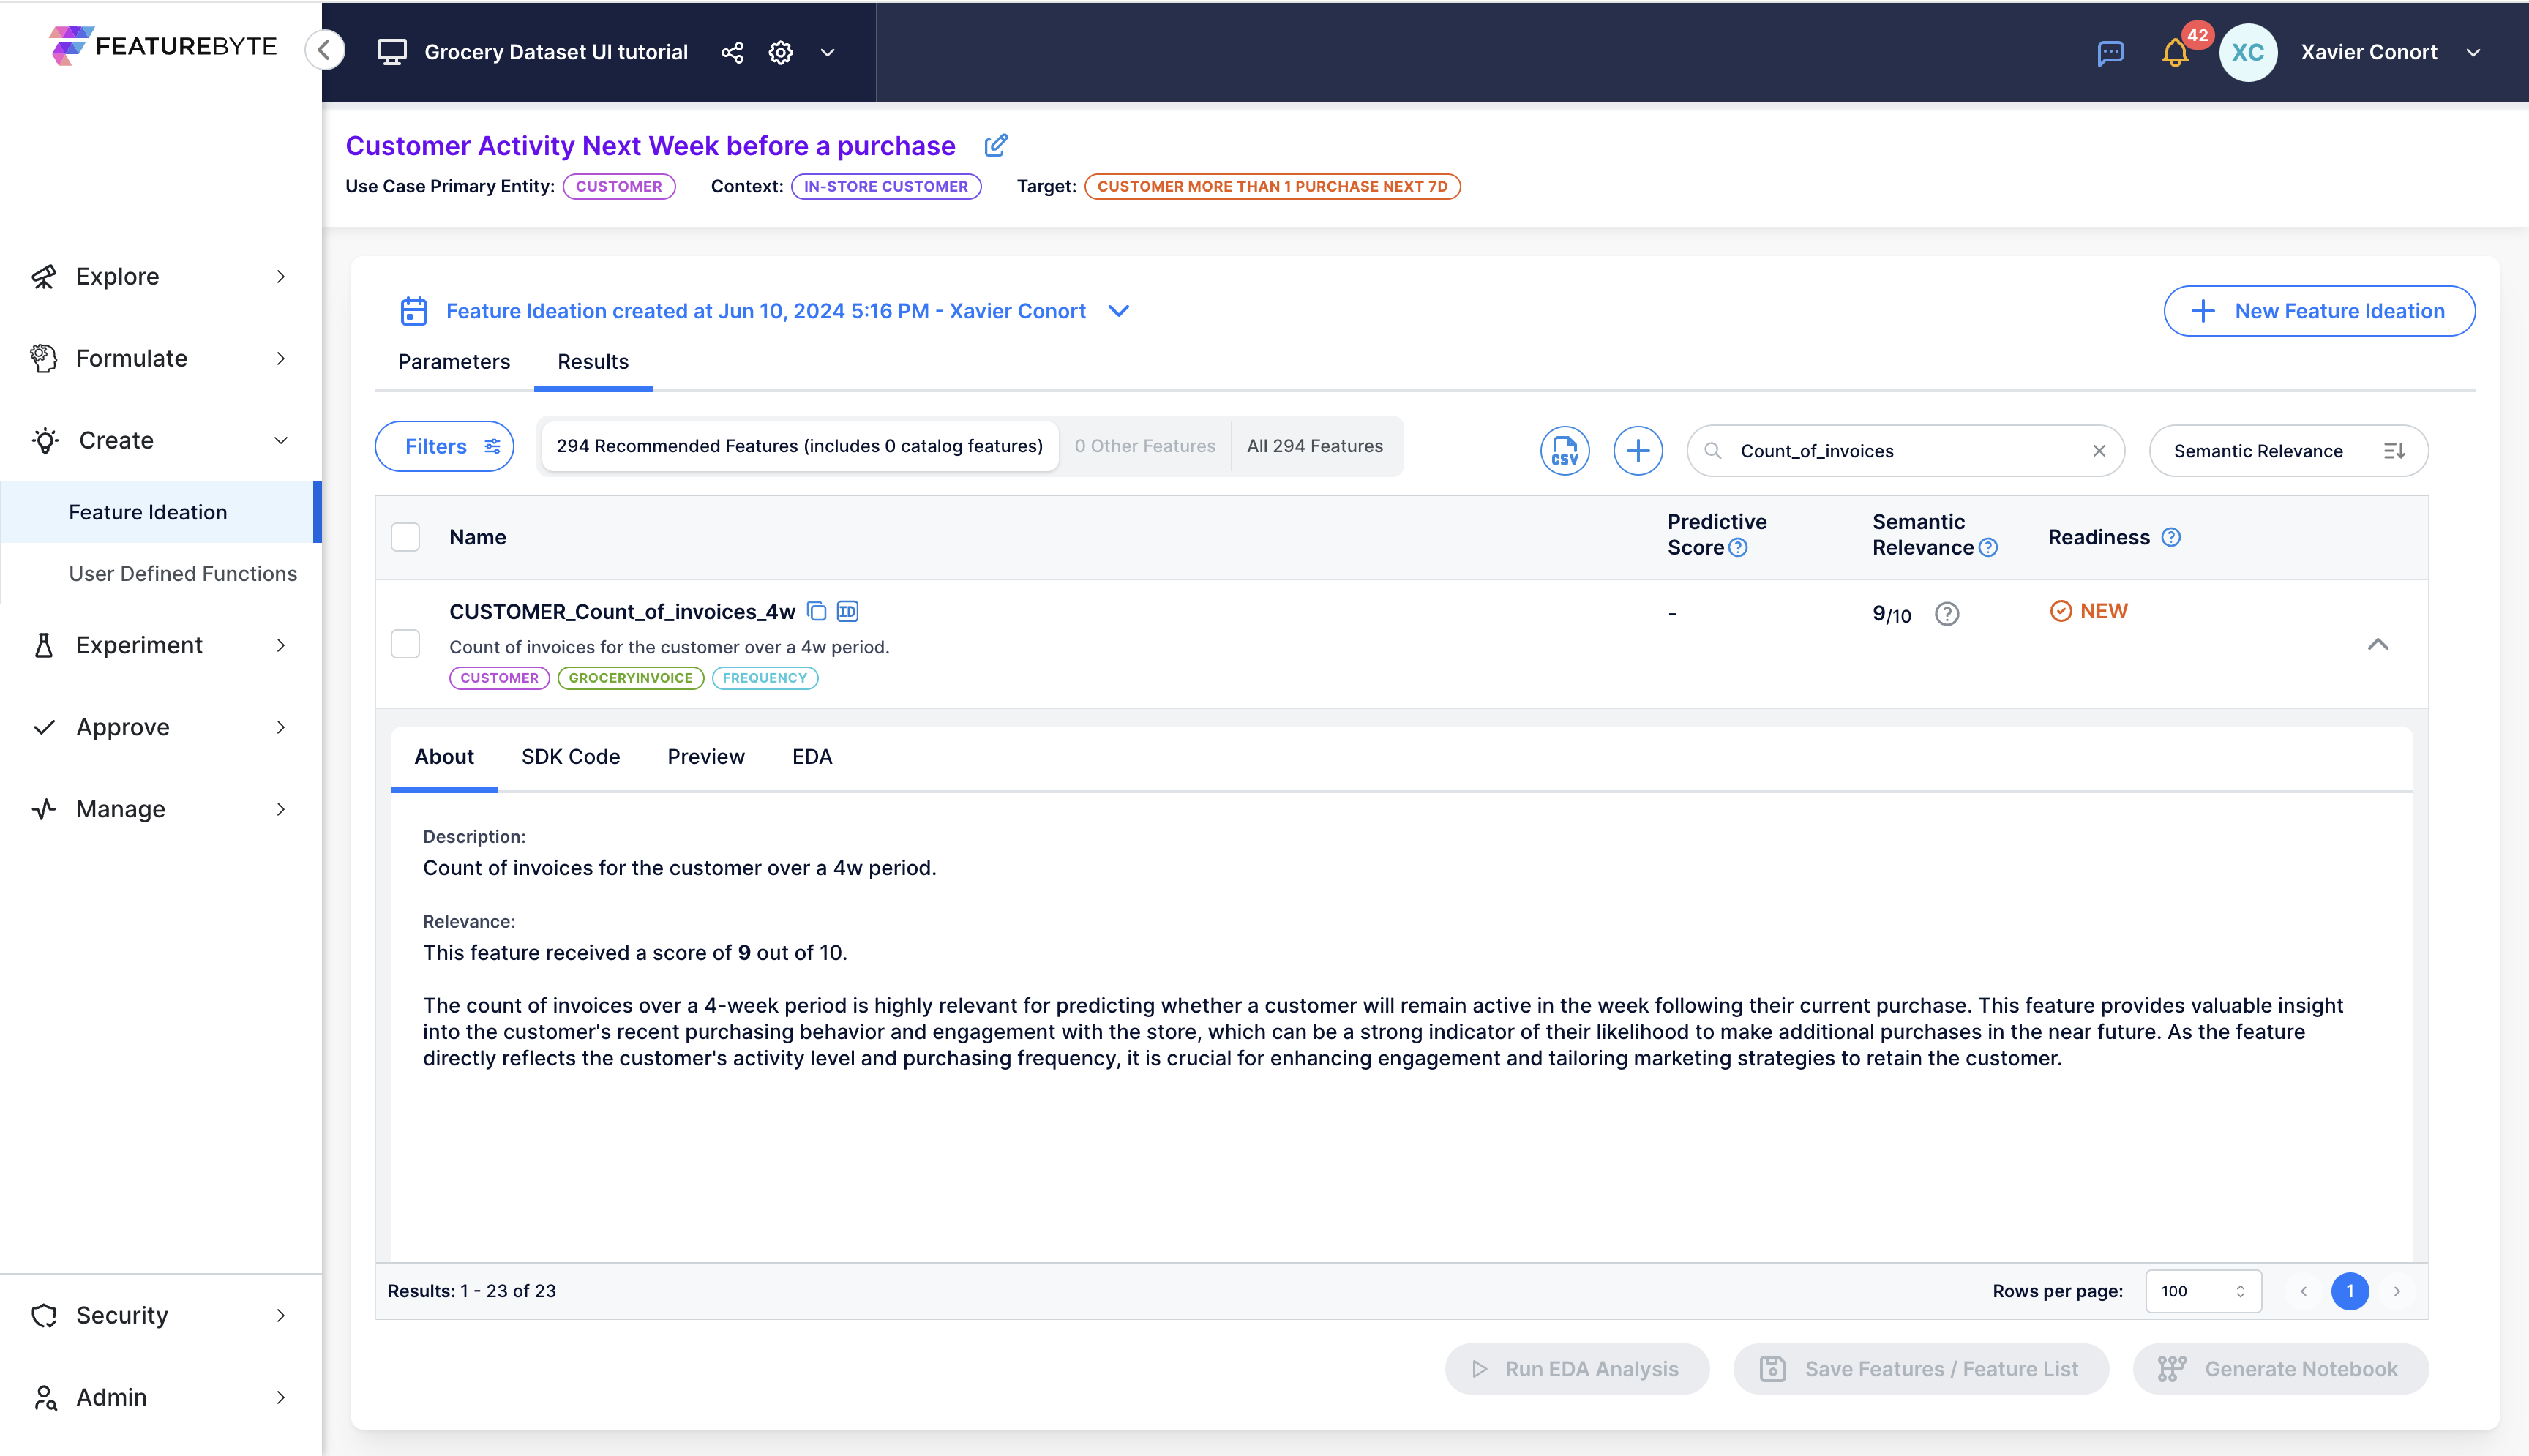
CUSTOMER_Count_of_invoices_4w
Let's explore the specifics of a simple feature: CUSTOMER_Count_of_invoices_4w by using the search function and typing  .
.
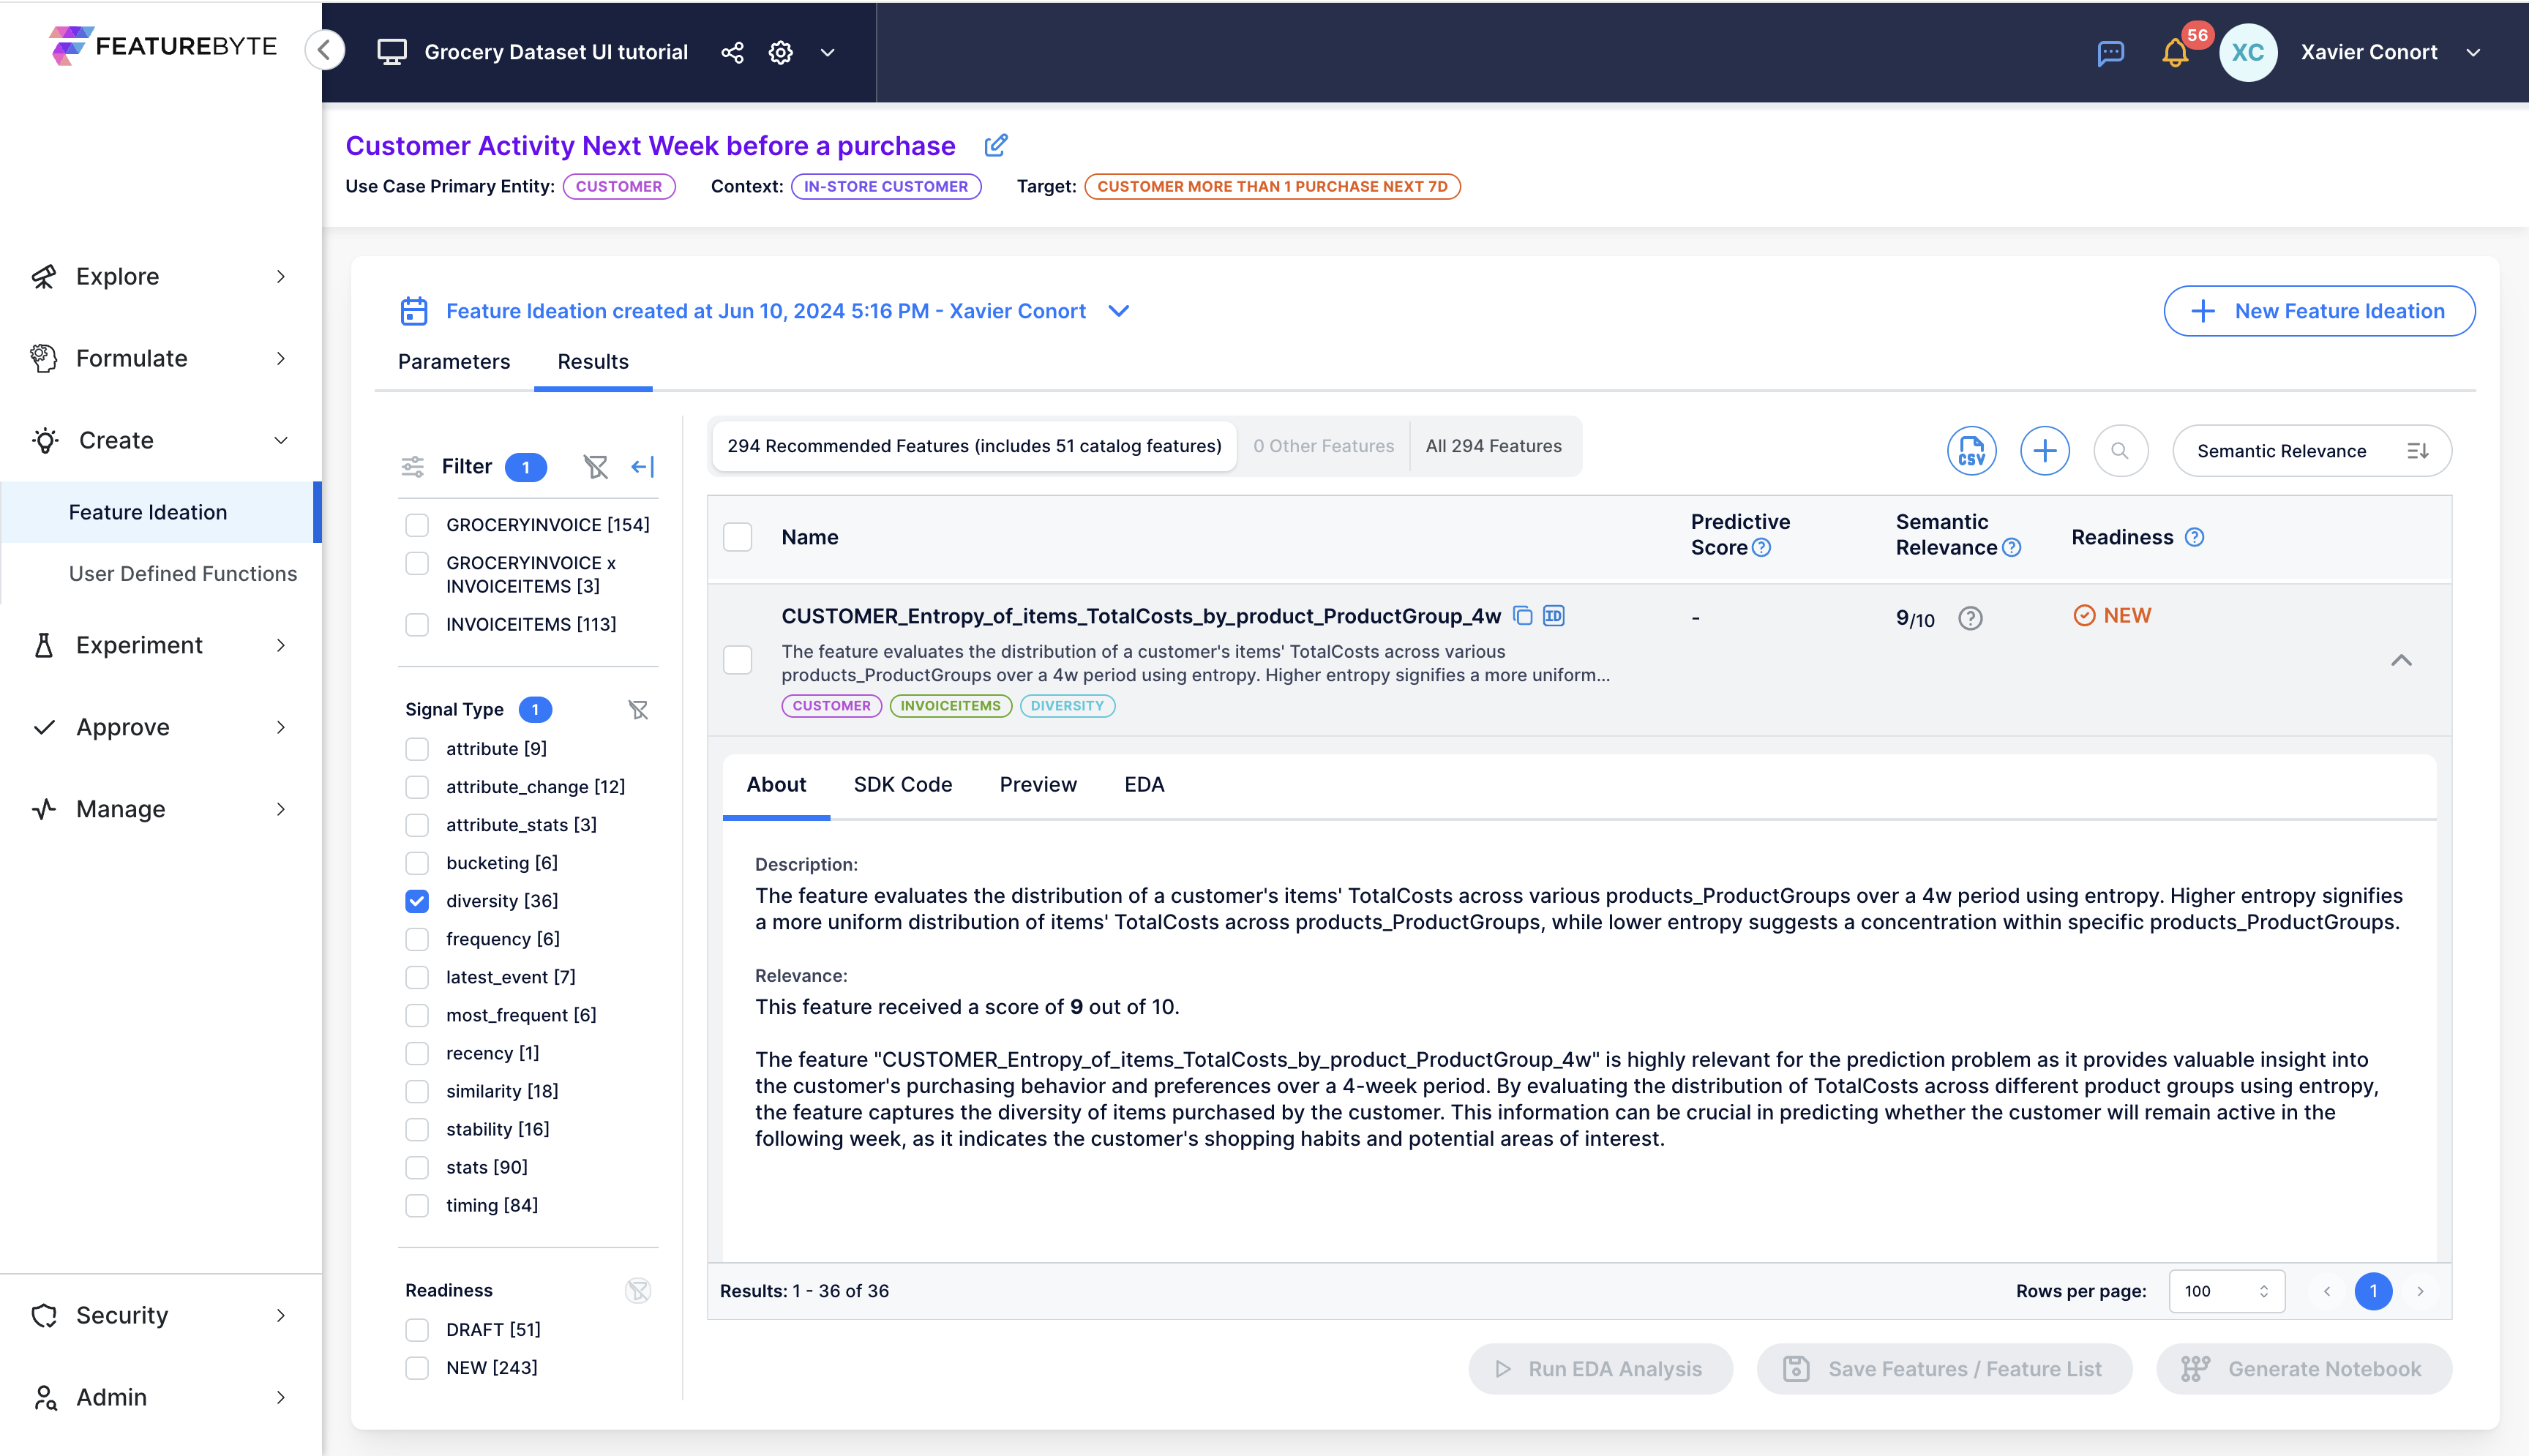
'About' Tab
This tab offers a concise description of the feature alongside an evaluation of its relevance to the use case by Generative AI.
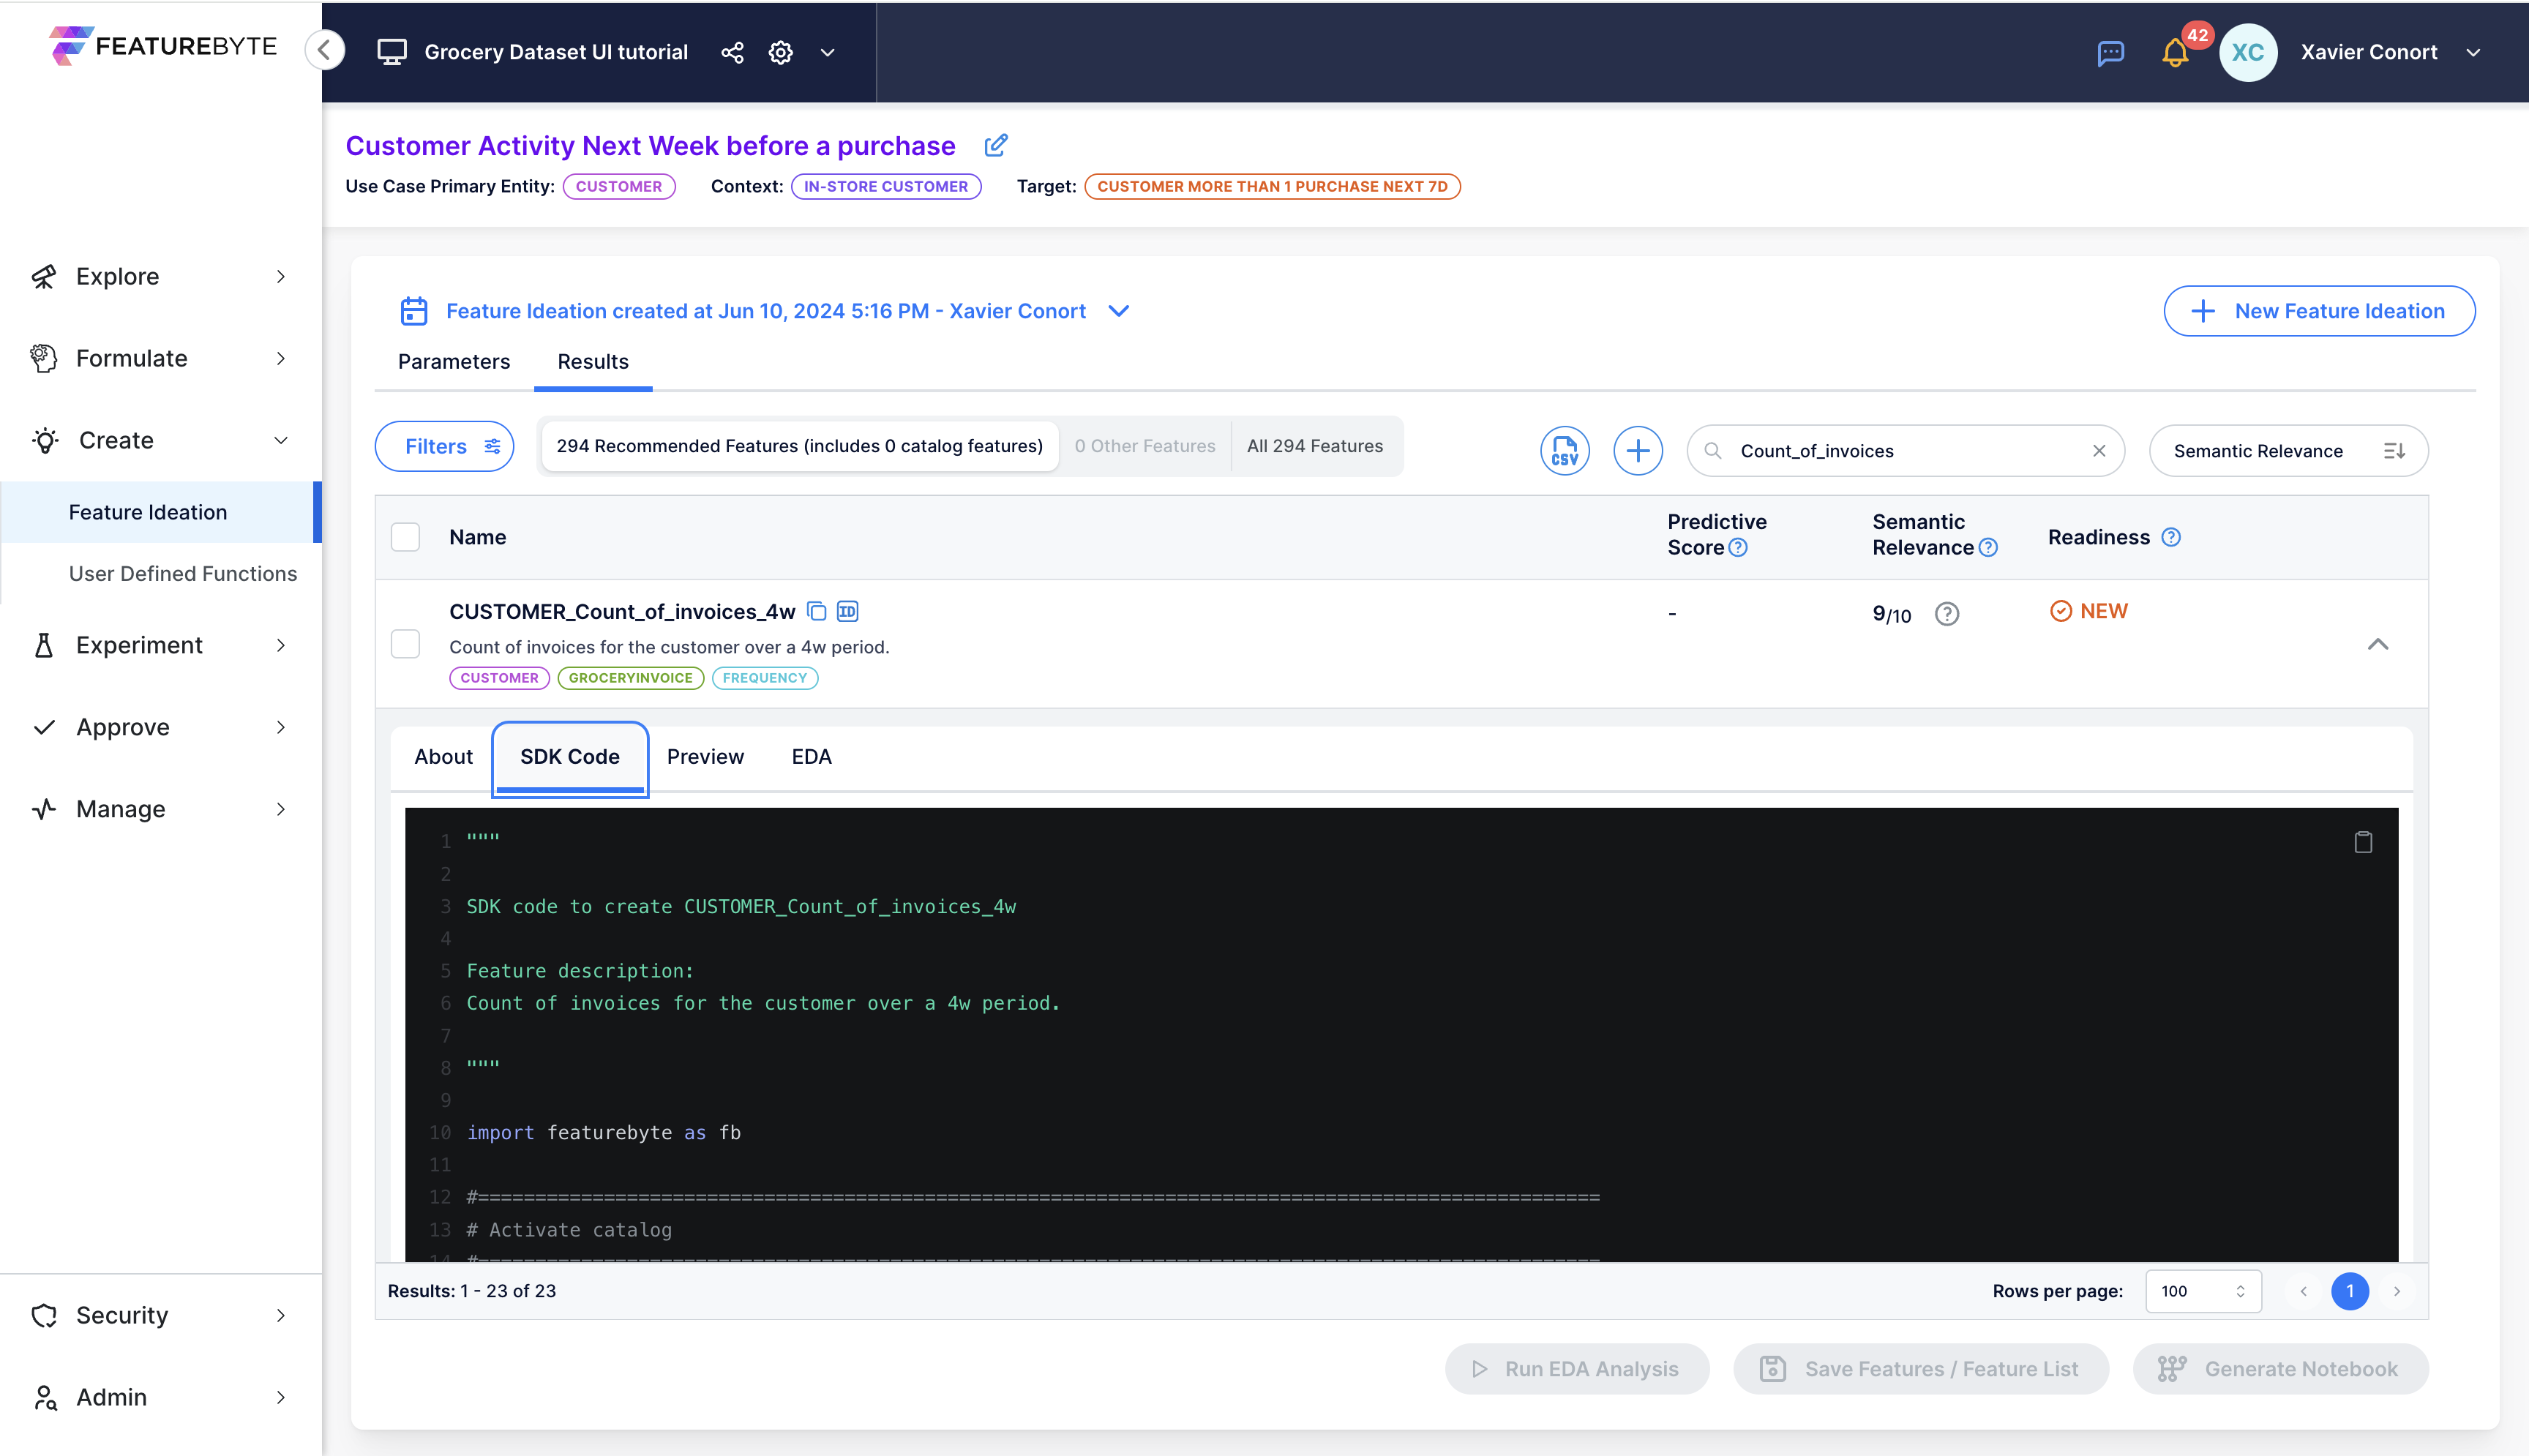
'SDK' Tab
Here, you'll find the SDK code snippet to generate this feature. Feel free to download and customize the code by selecting the feature and clicking "generate notebook". We will give an example in the final section of this tutorial series.
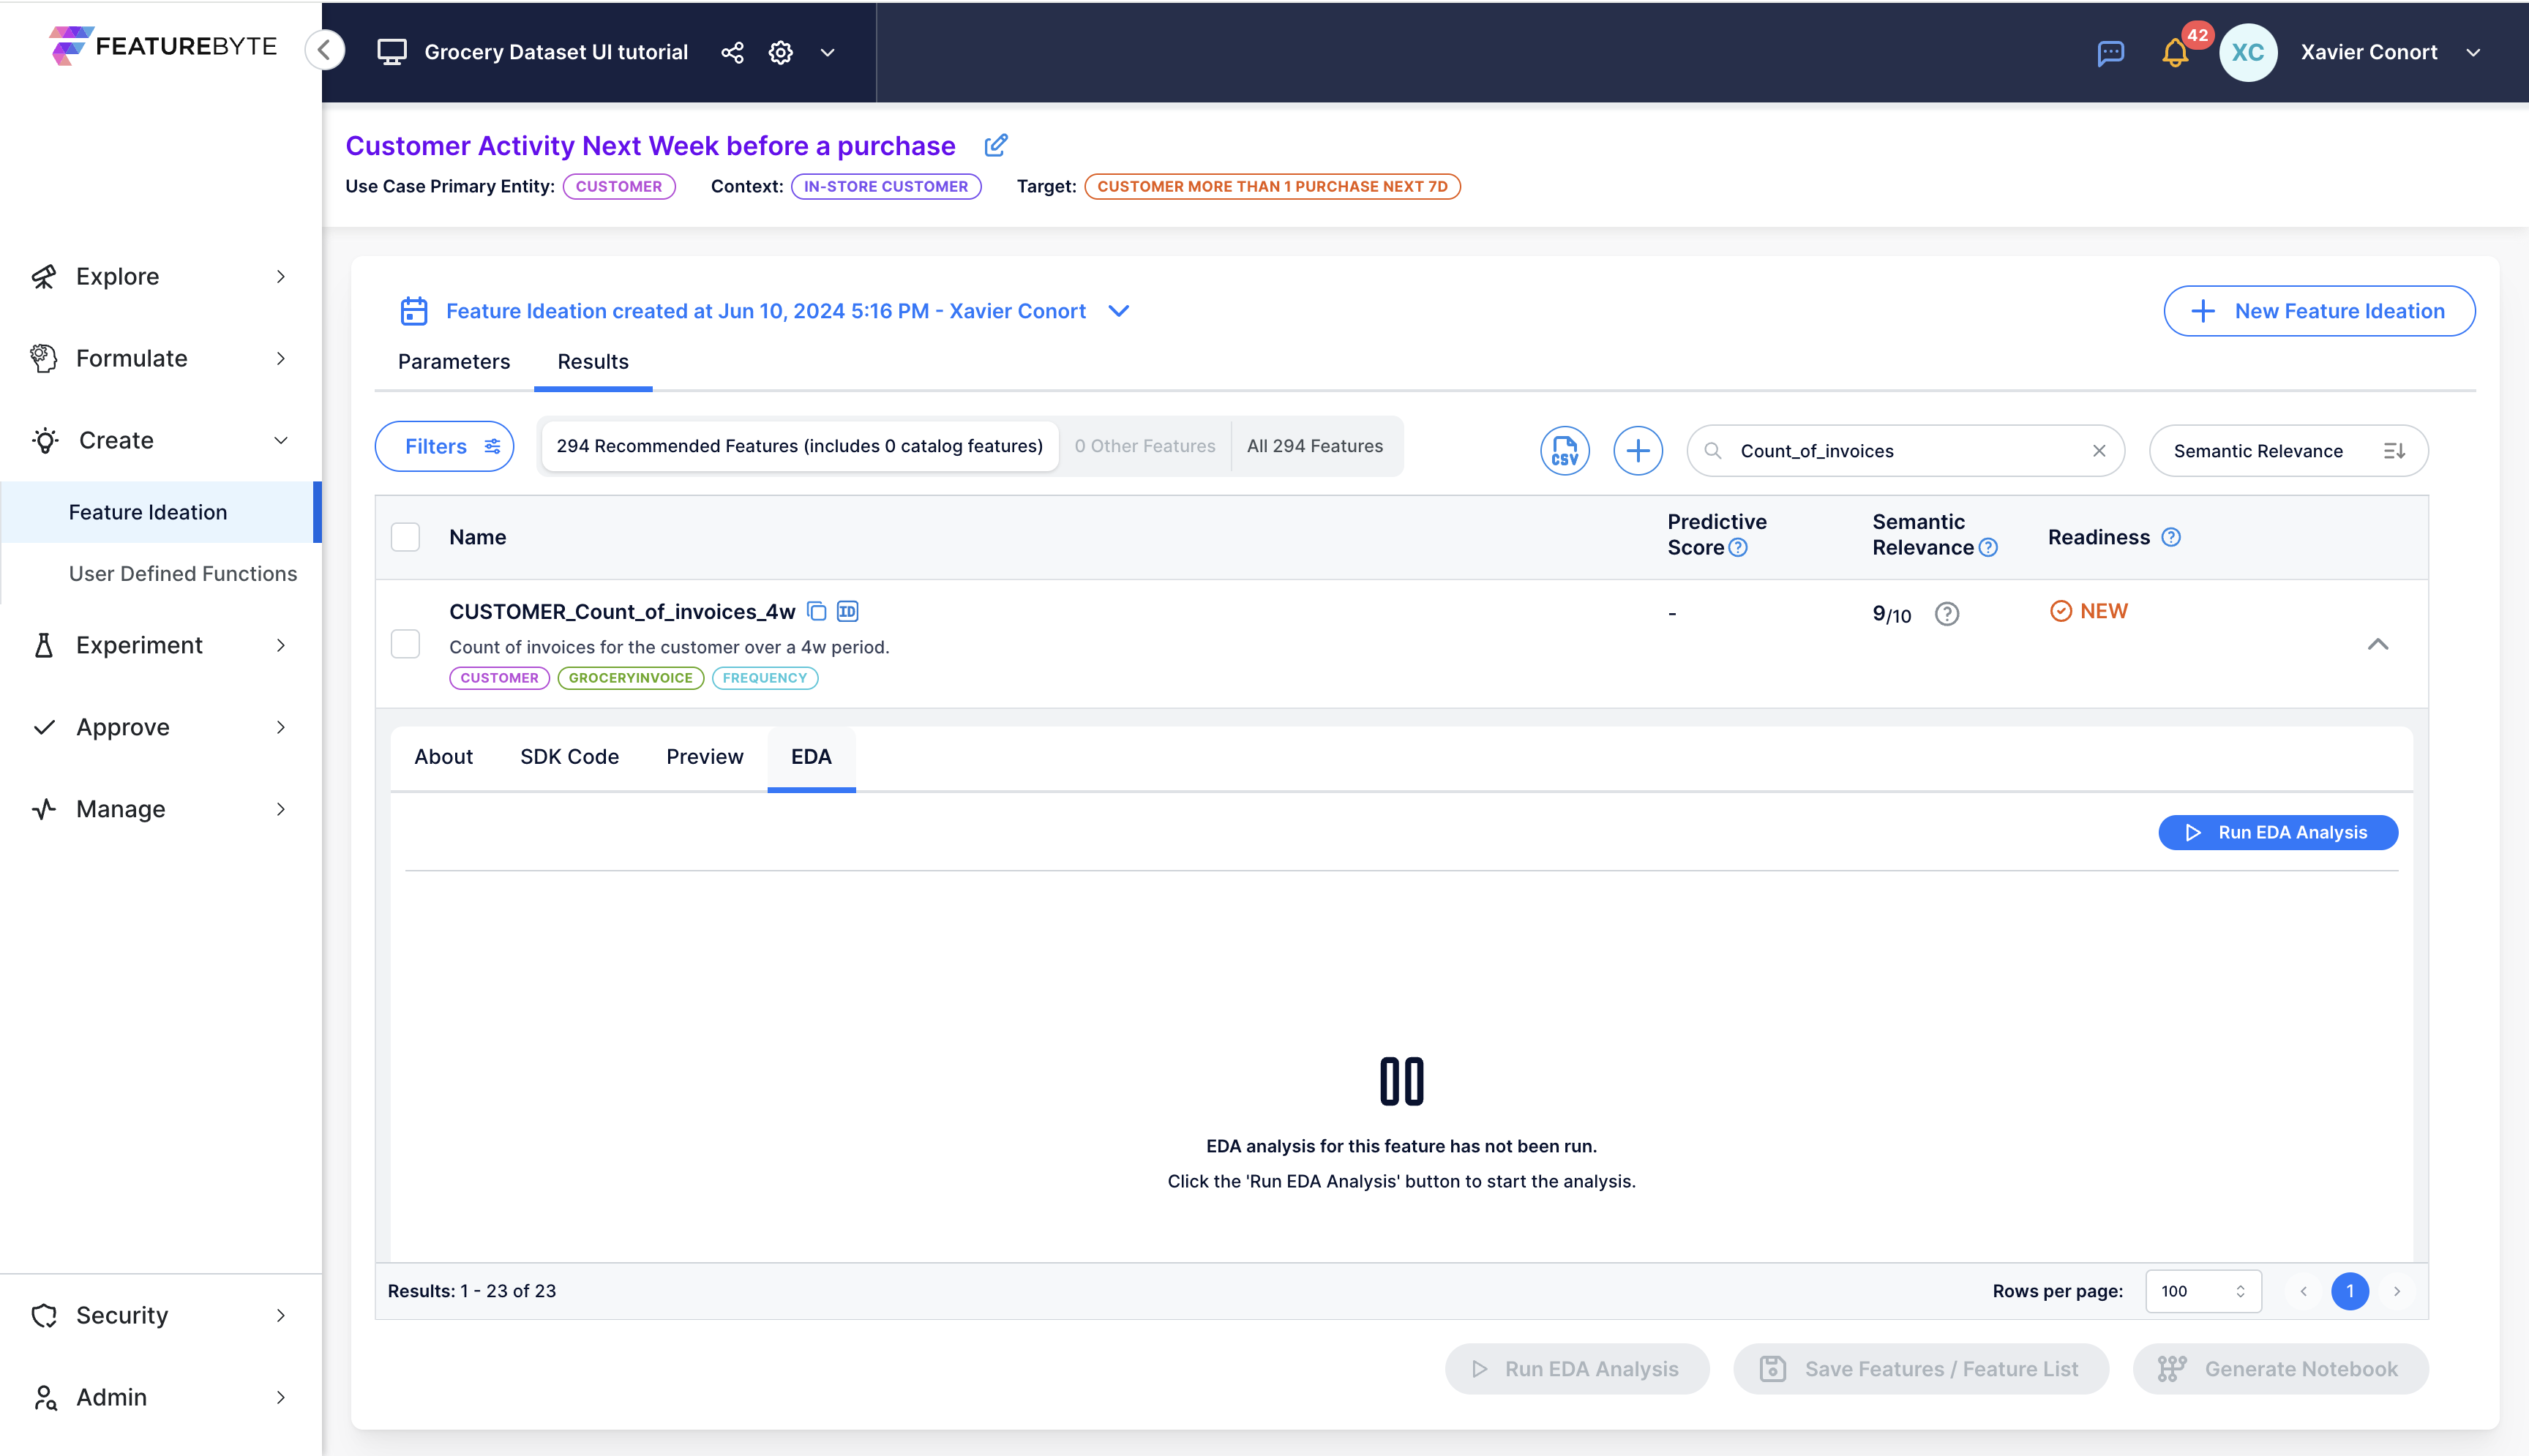
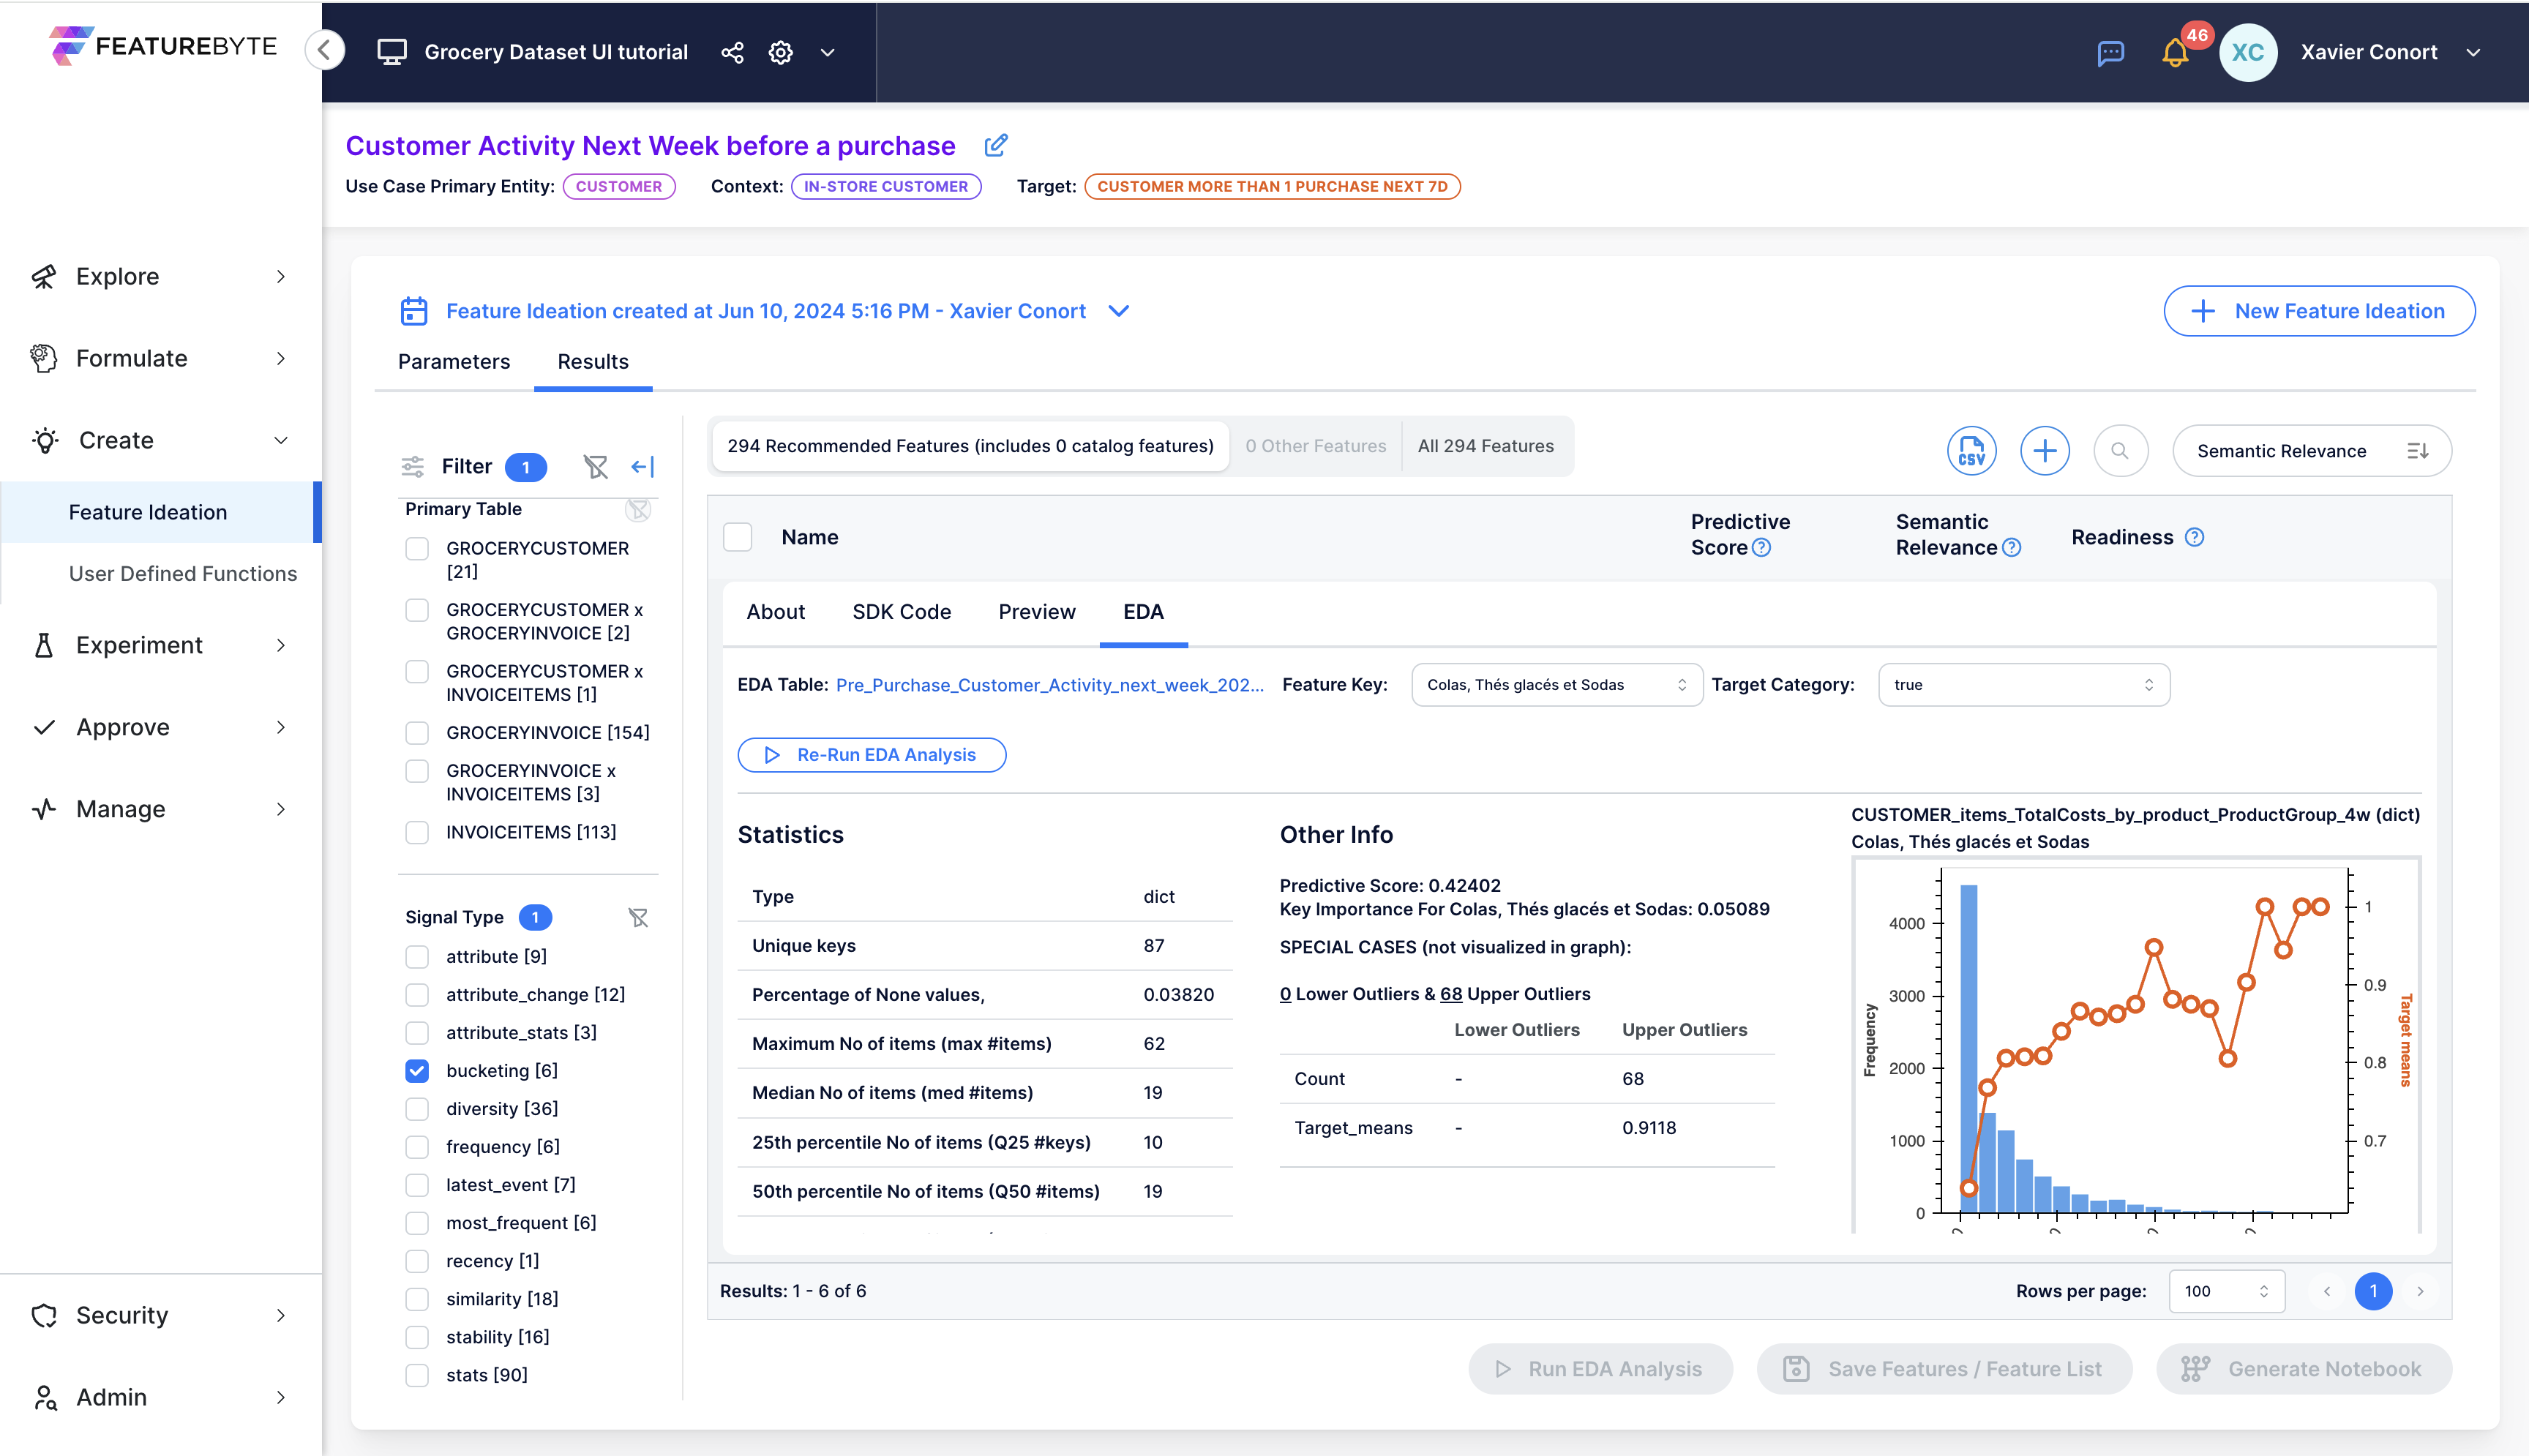
'EDA' Tab
Access an on-demand Exploratory Data Analysis (EDA) in this section. Ensure you've set a default EDA table for the use case in the "07 Create Observation Tables" section.
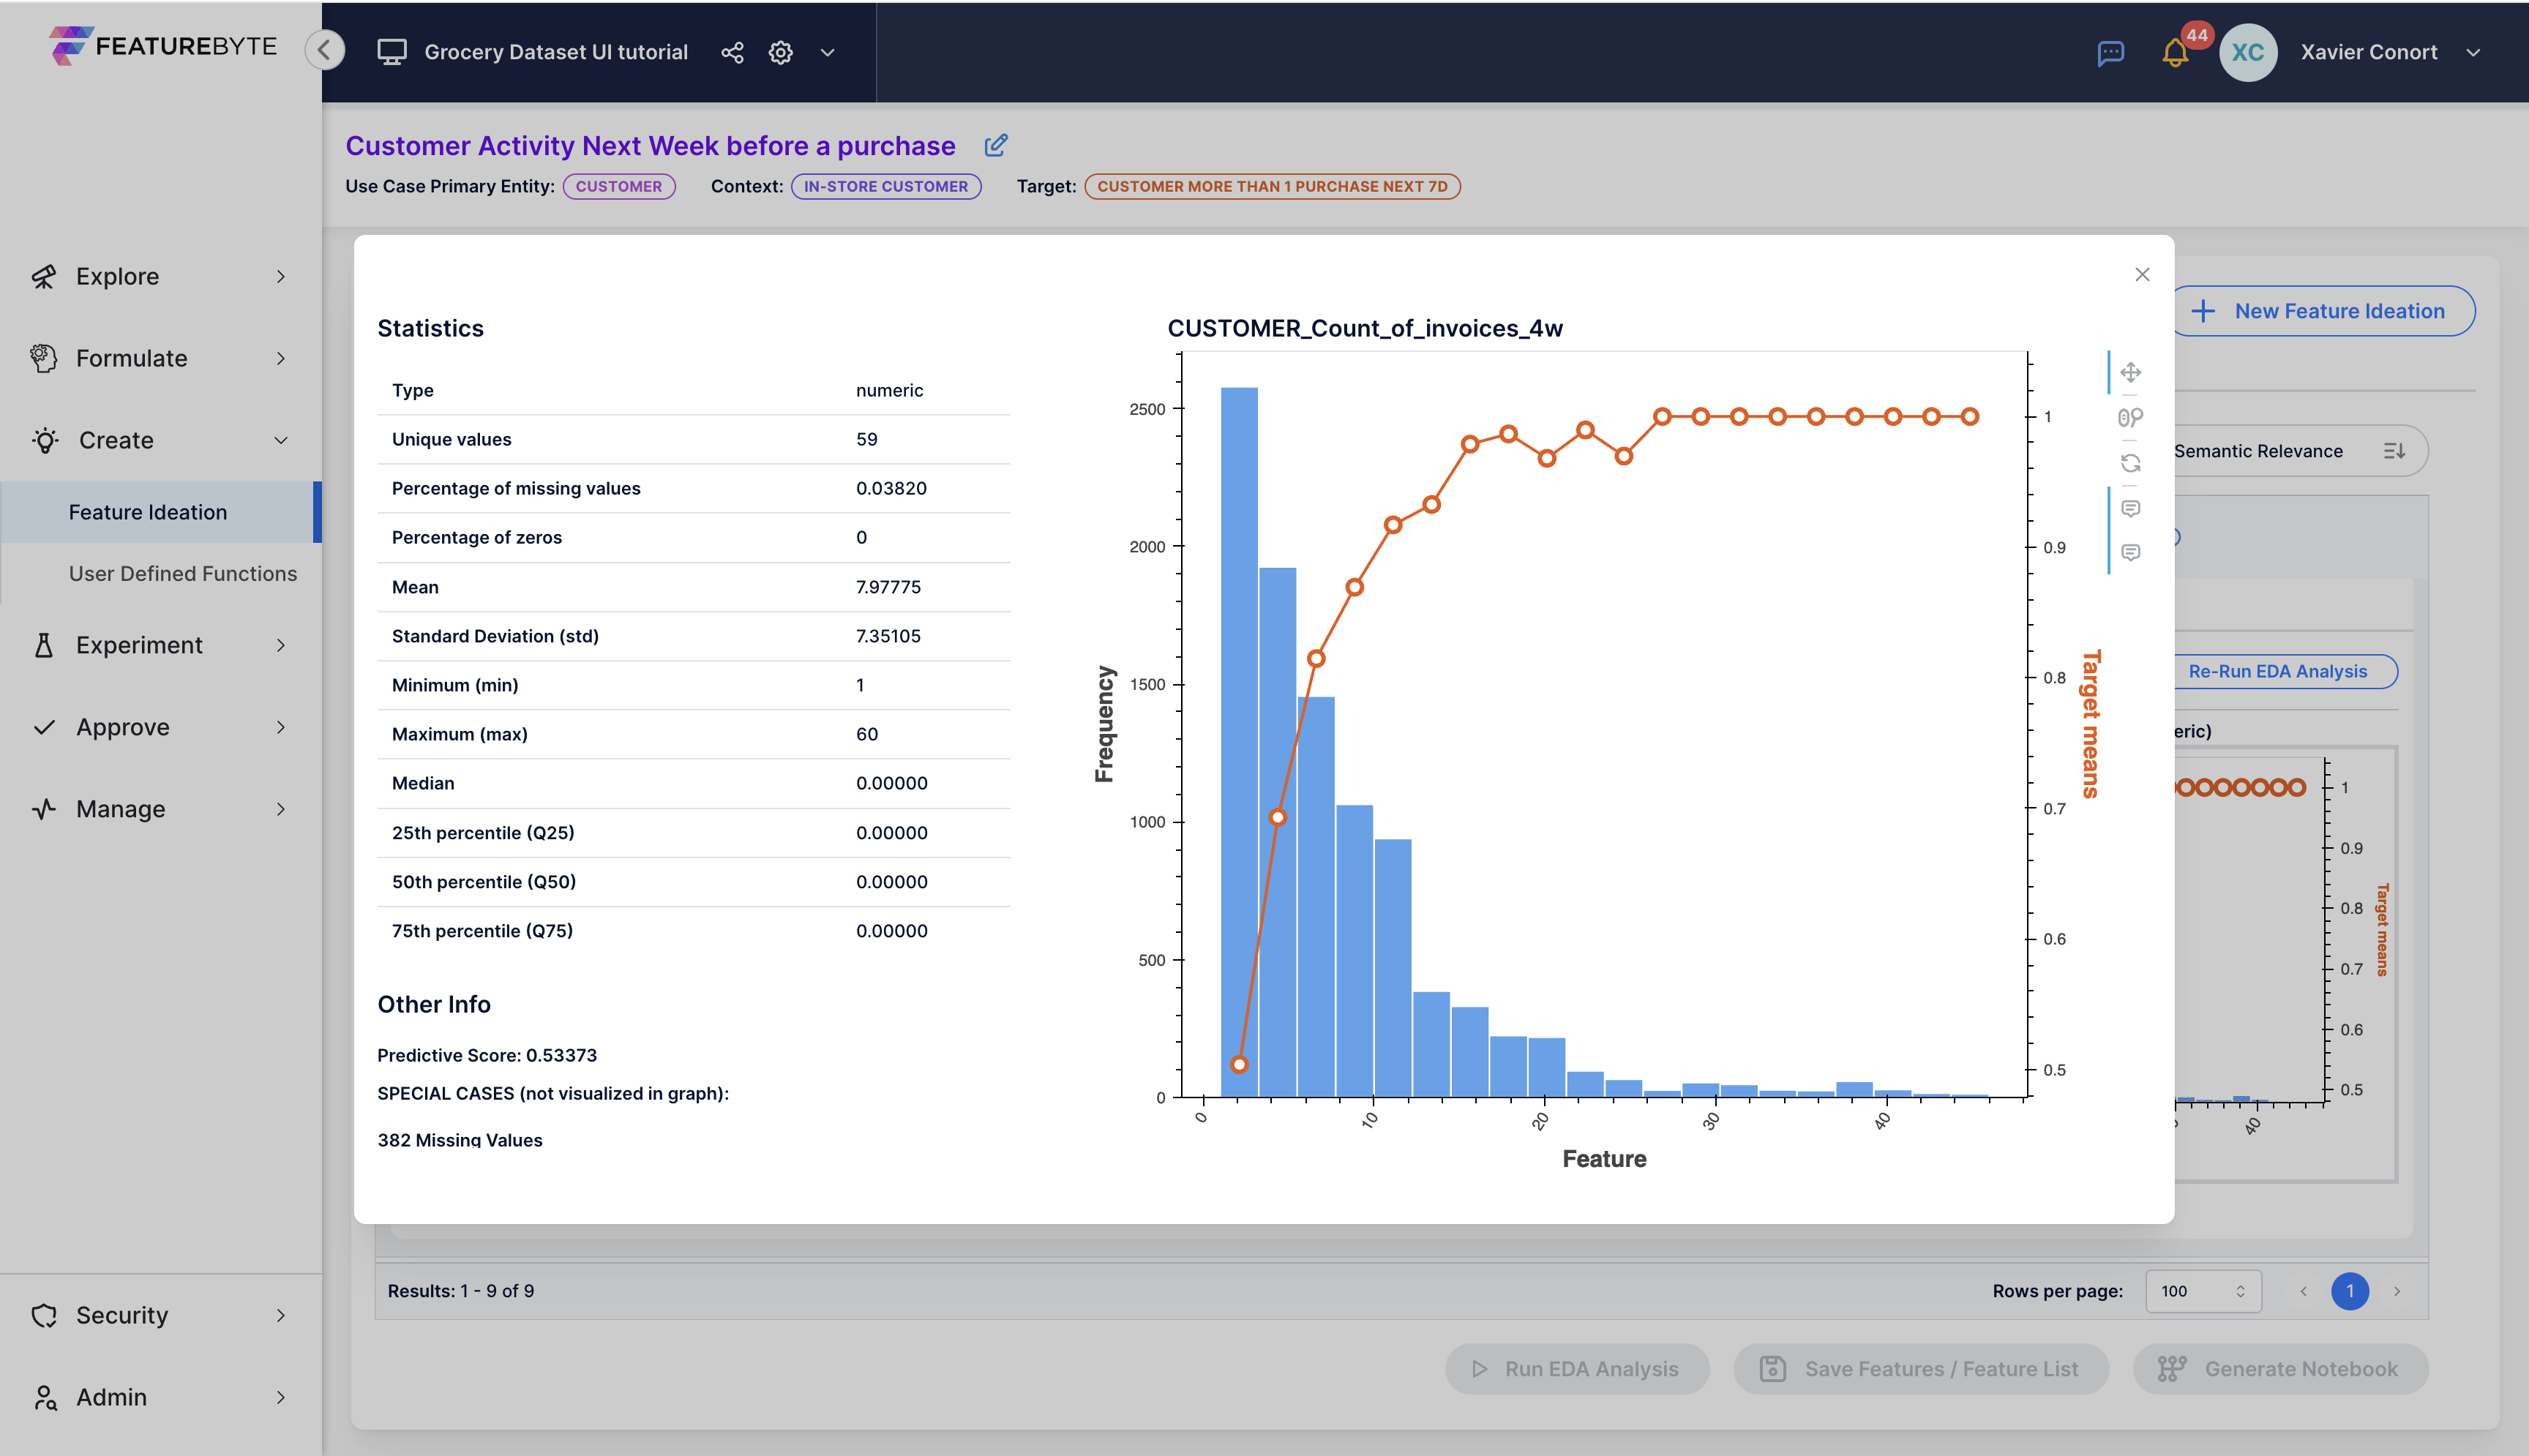
The EDA outcomes provide statistical insights on the feature, including its distribution and correlation with the target. A predictive score encapsulates these findings, quantified as R² in regression scenarios and as 2x(AUC-0.5) in classification contexts. A score of 1 indicates perfect correlation with the target, while a score of 0 signifies no correlation.
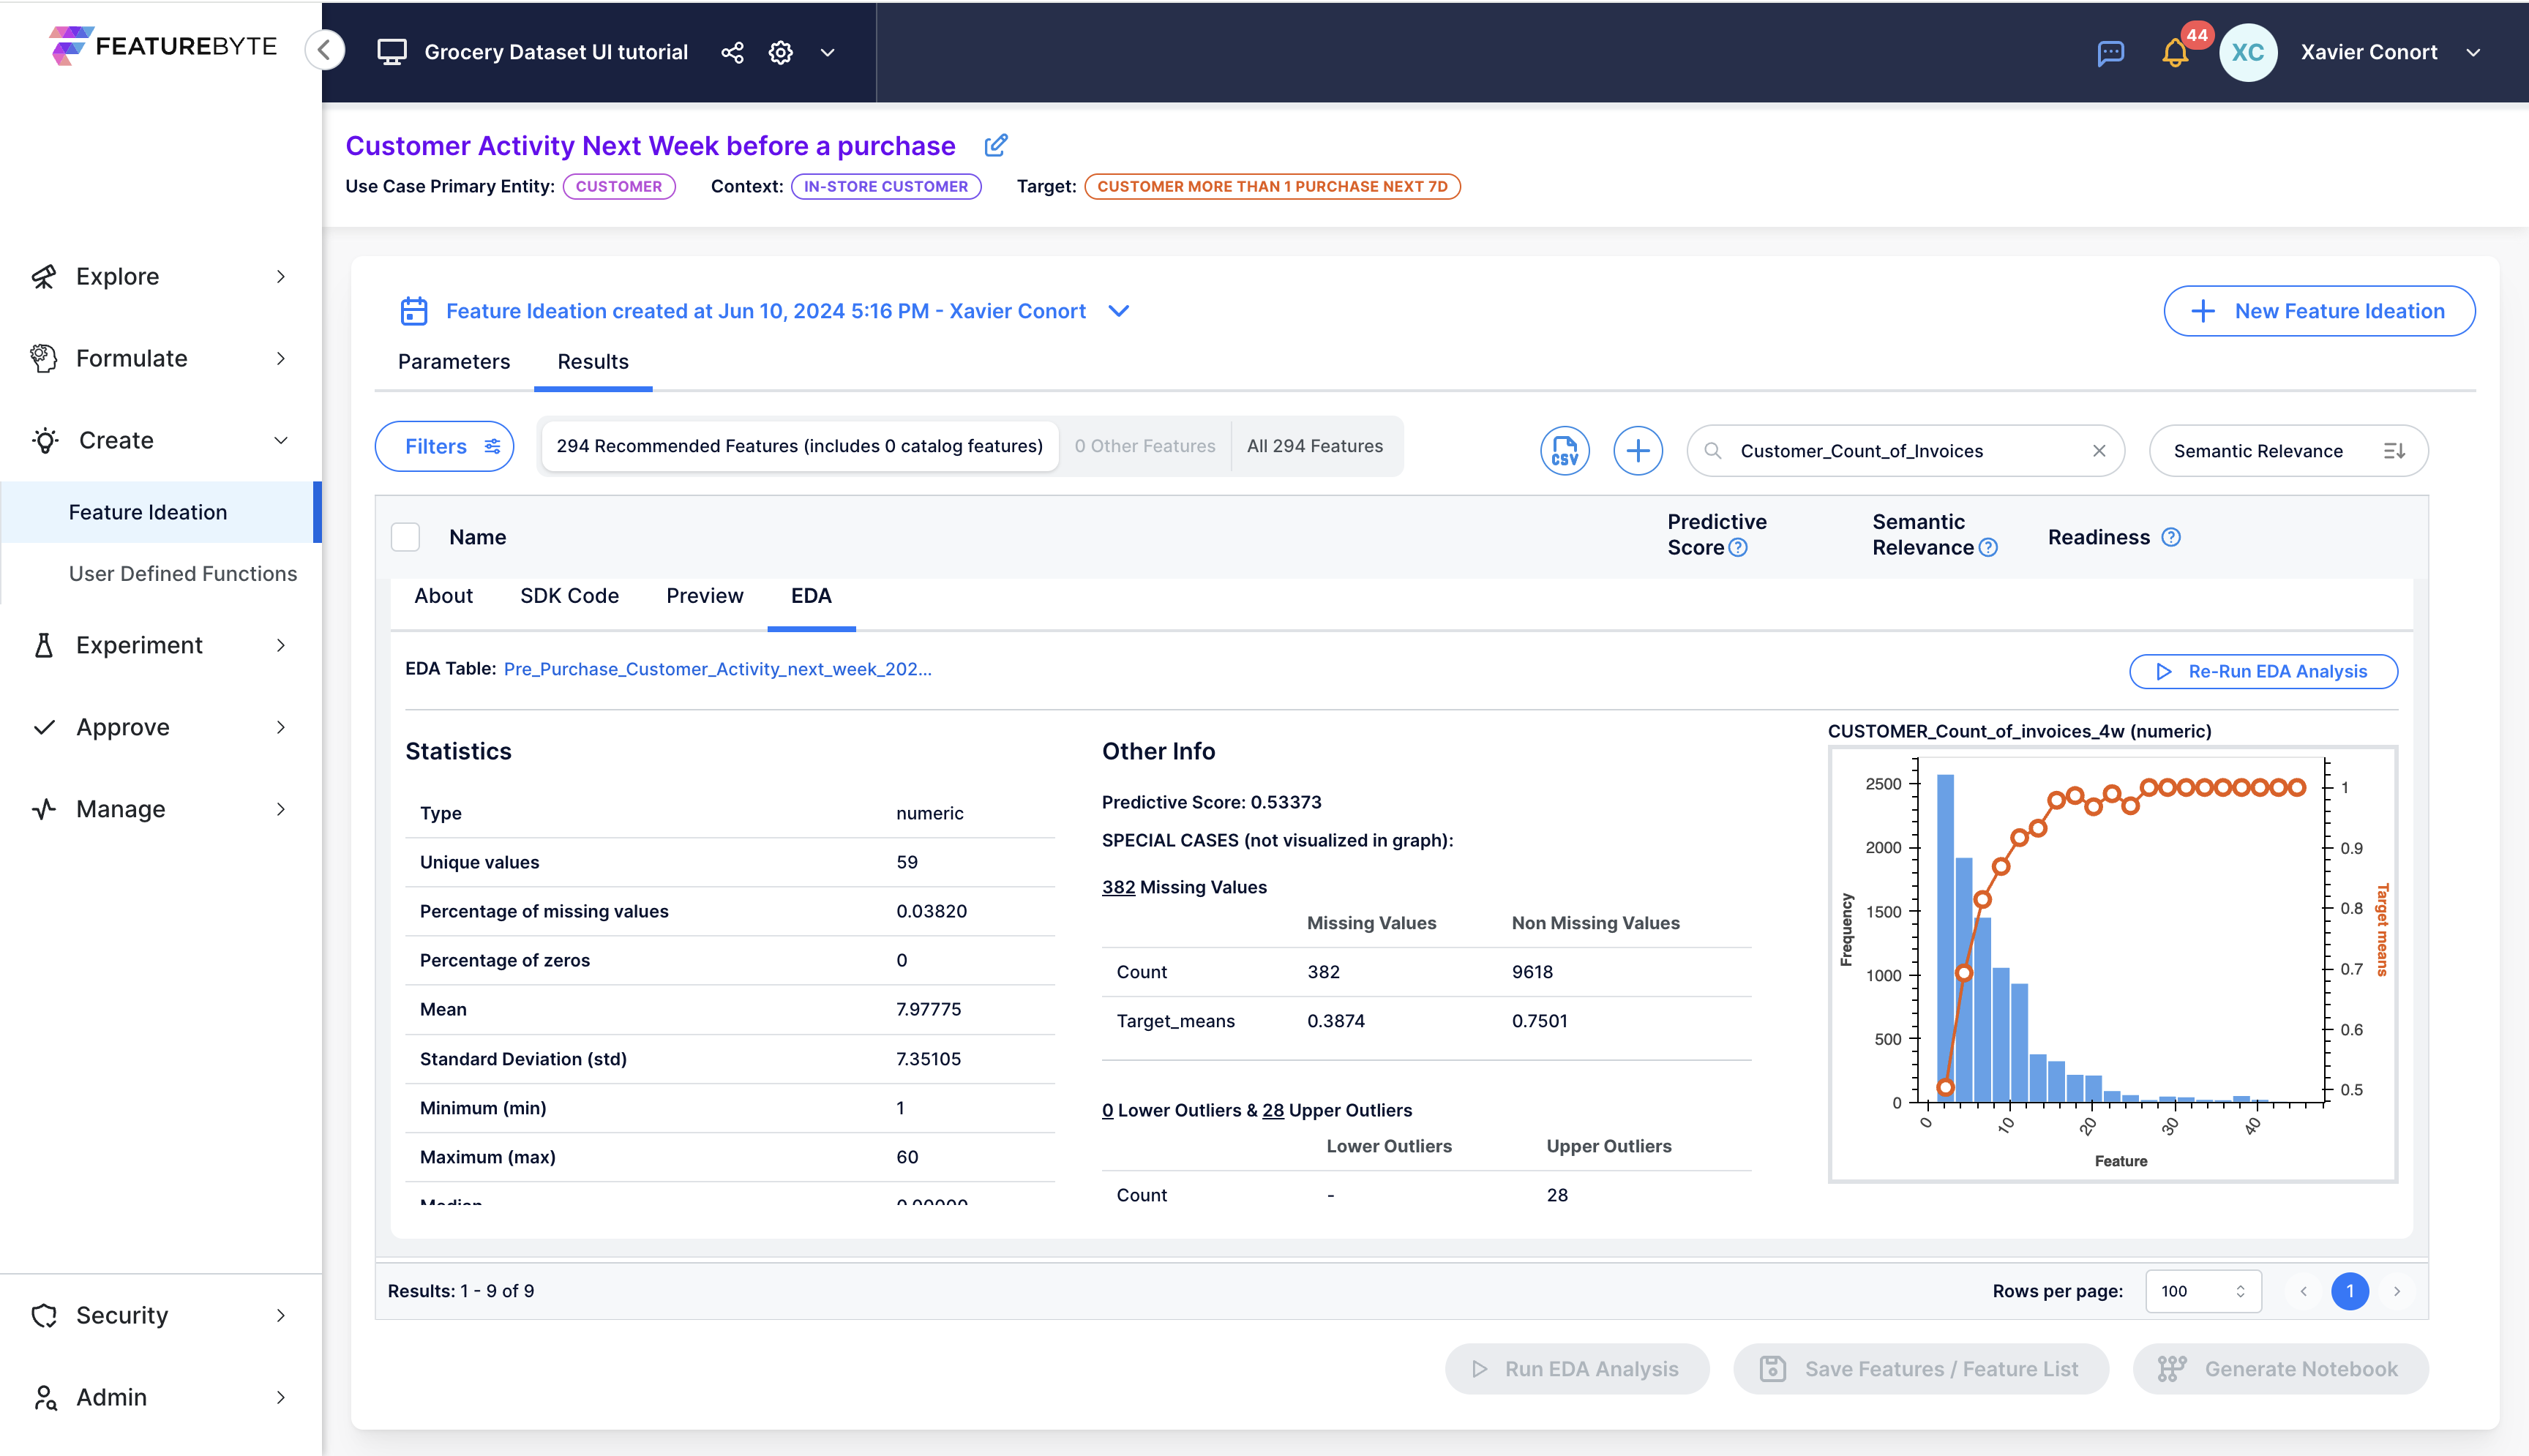
Click on the graph to open a pop-up window for detailed analysis.
CUSTOMER_items_TotalCosts_by_product_ProductGroup_4w
First let's clear our prior search ![]() .
.
You can now access CUSTOMER_items_TotalCosts_by_product_ProductGroup_4w by opening the filter bar: 
Select 'bucketing' as a signal type.
Let's run EDA for CUSTOMER_items_TotalCosts_by_product_ProductGroup_4w.
Graphs are provided for each Product Group. You can select the desired Product Group in the "Feature Key" dropdown menu. The Product Group with the highest importance, as determined by an XGBoost model predicting customer activity the next week, is listed first.
Notably, expenditure on colas and sodas emerges as the most significant!
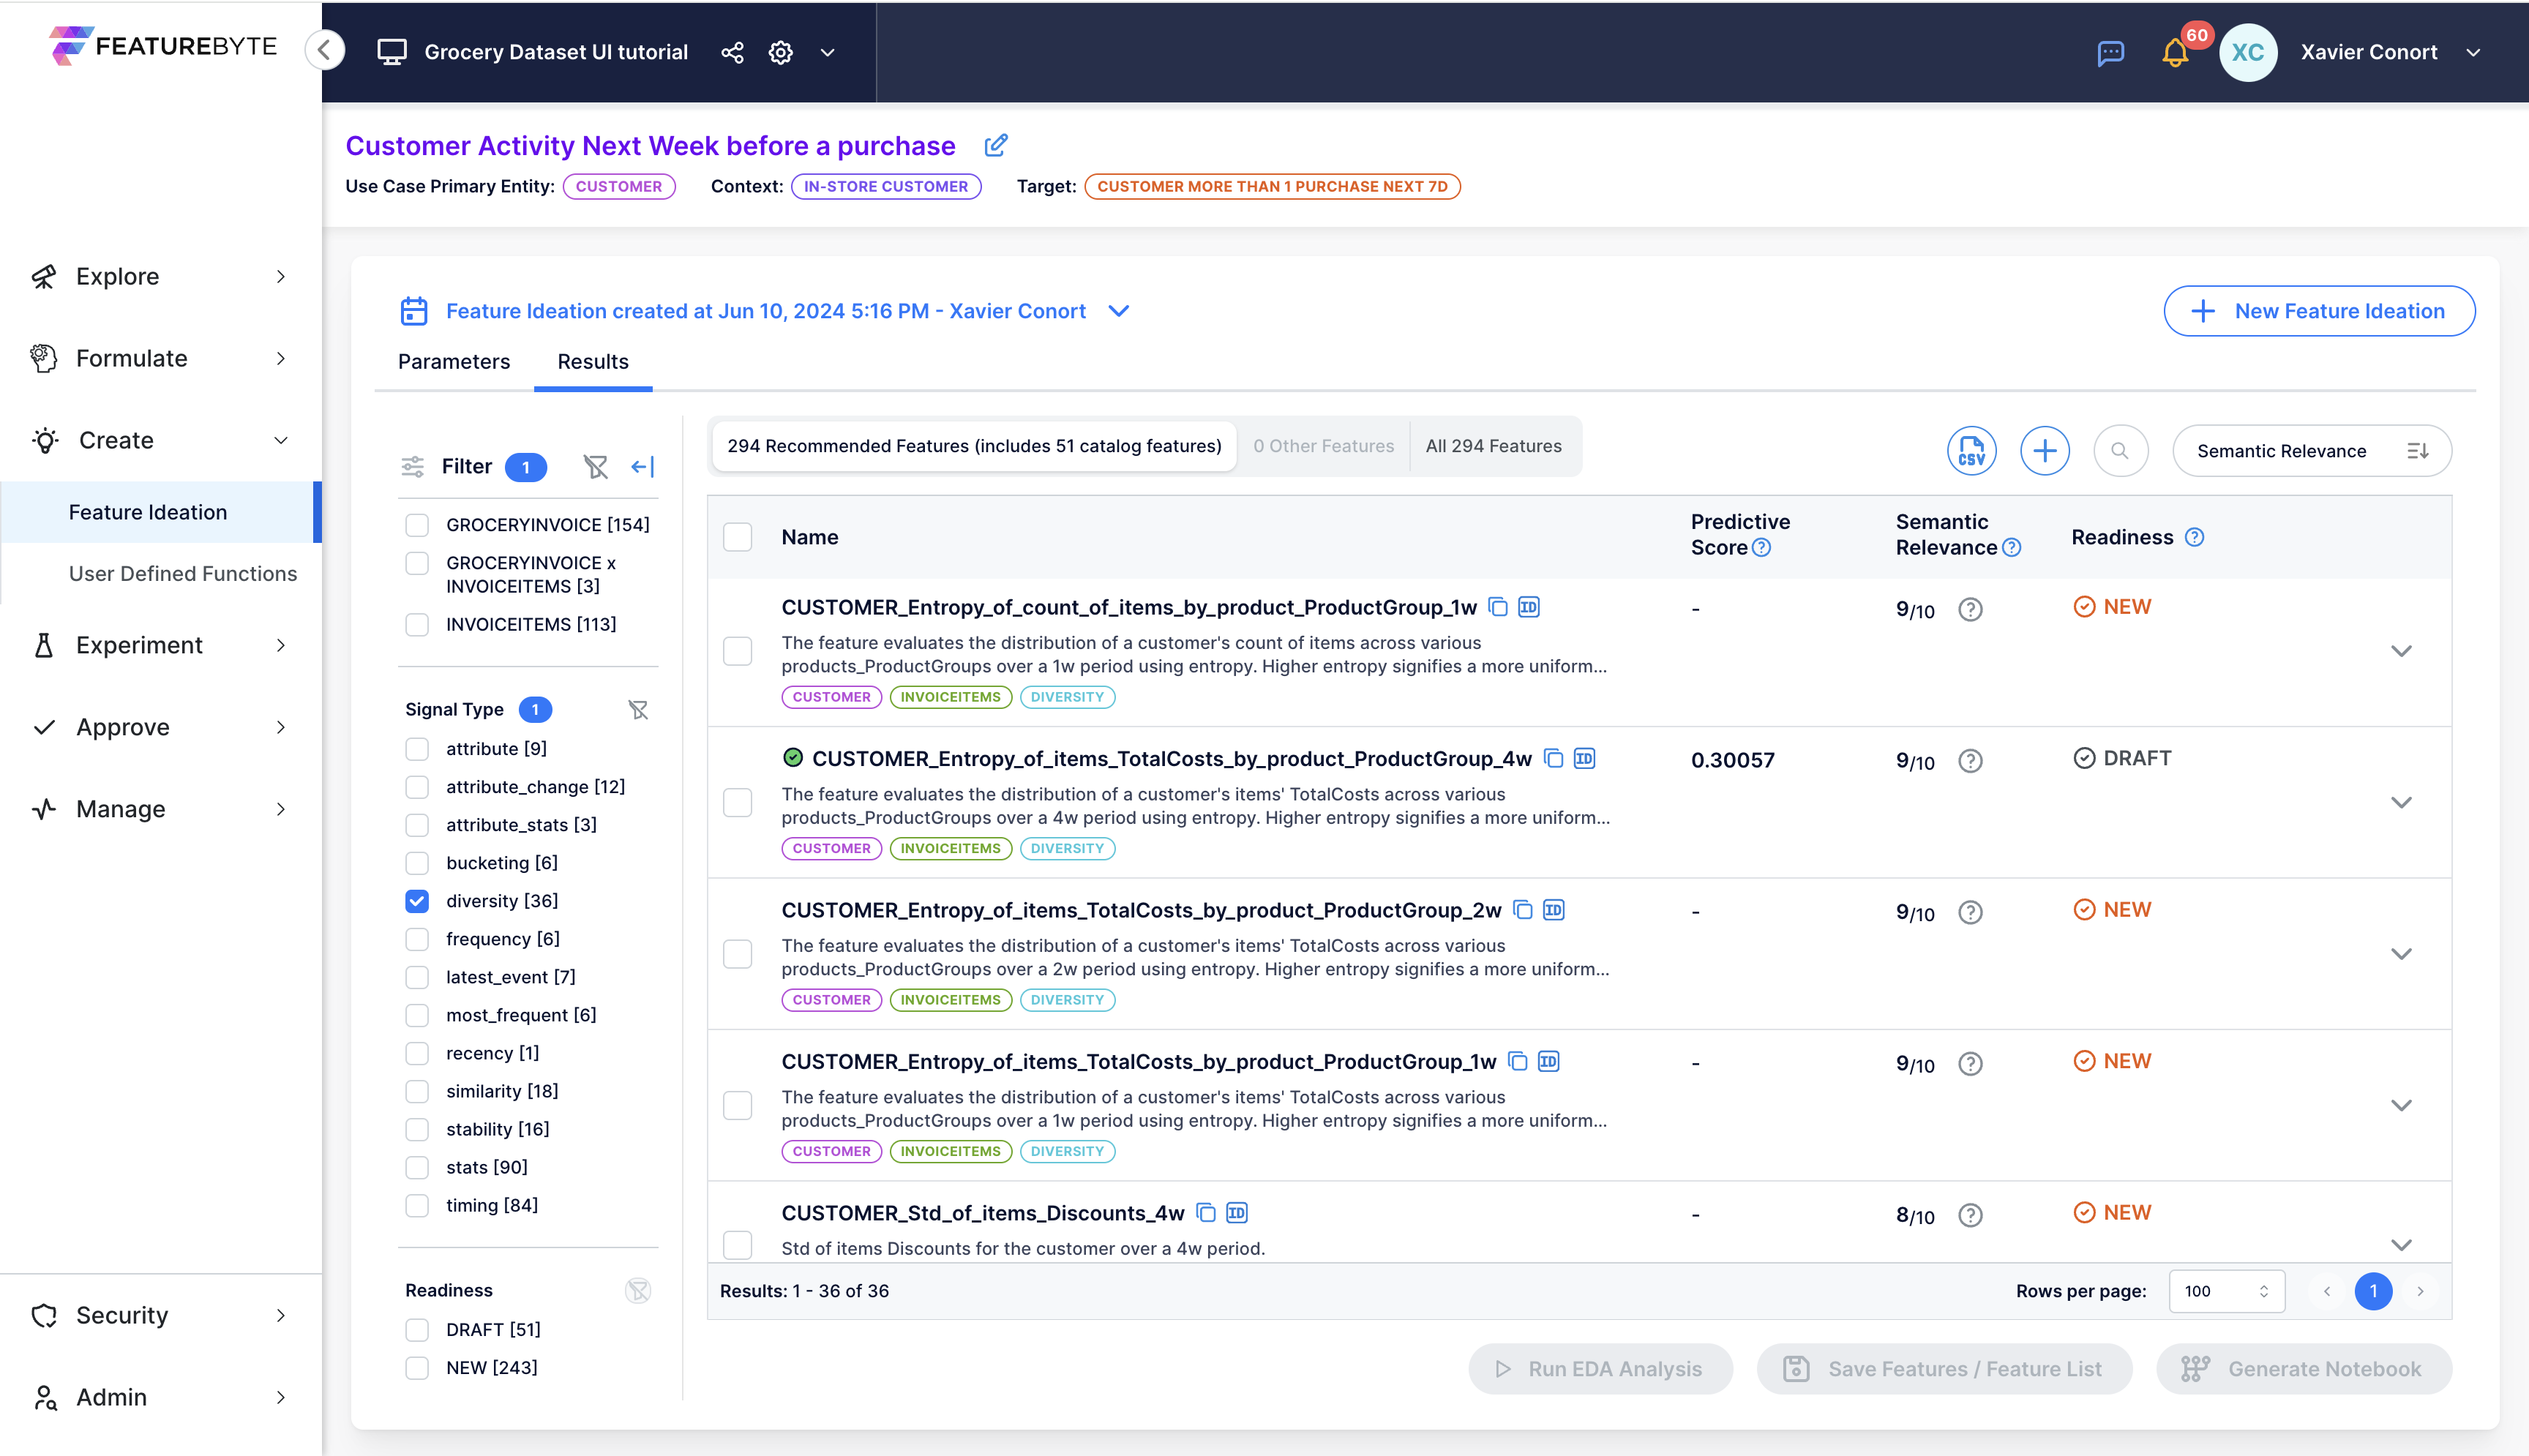
CUSTOMER_Entropy_of_items_TotalCosts_by_product_ProductGroup_4w
Let's explore a feature derived from "CUSTOMER_items_TotalCosts_by_product_ProductGroup_4w". This feature measures the diversity of the Customer's basket.
CUSTOMER_Entropy_of_items_TotalCosts_by_product_ProductGroup_4w can be found by selecting 'diversity' as a signal type.
Let's run the EDA for CUSTOMER_Entropy_of_items_TotalCosts_by_product_ProductGroup_4w.
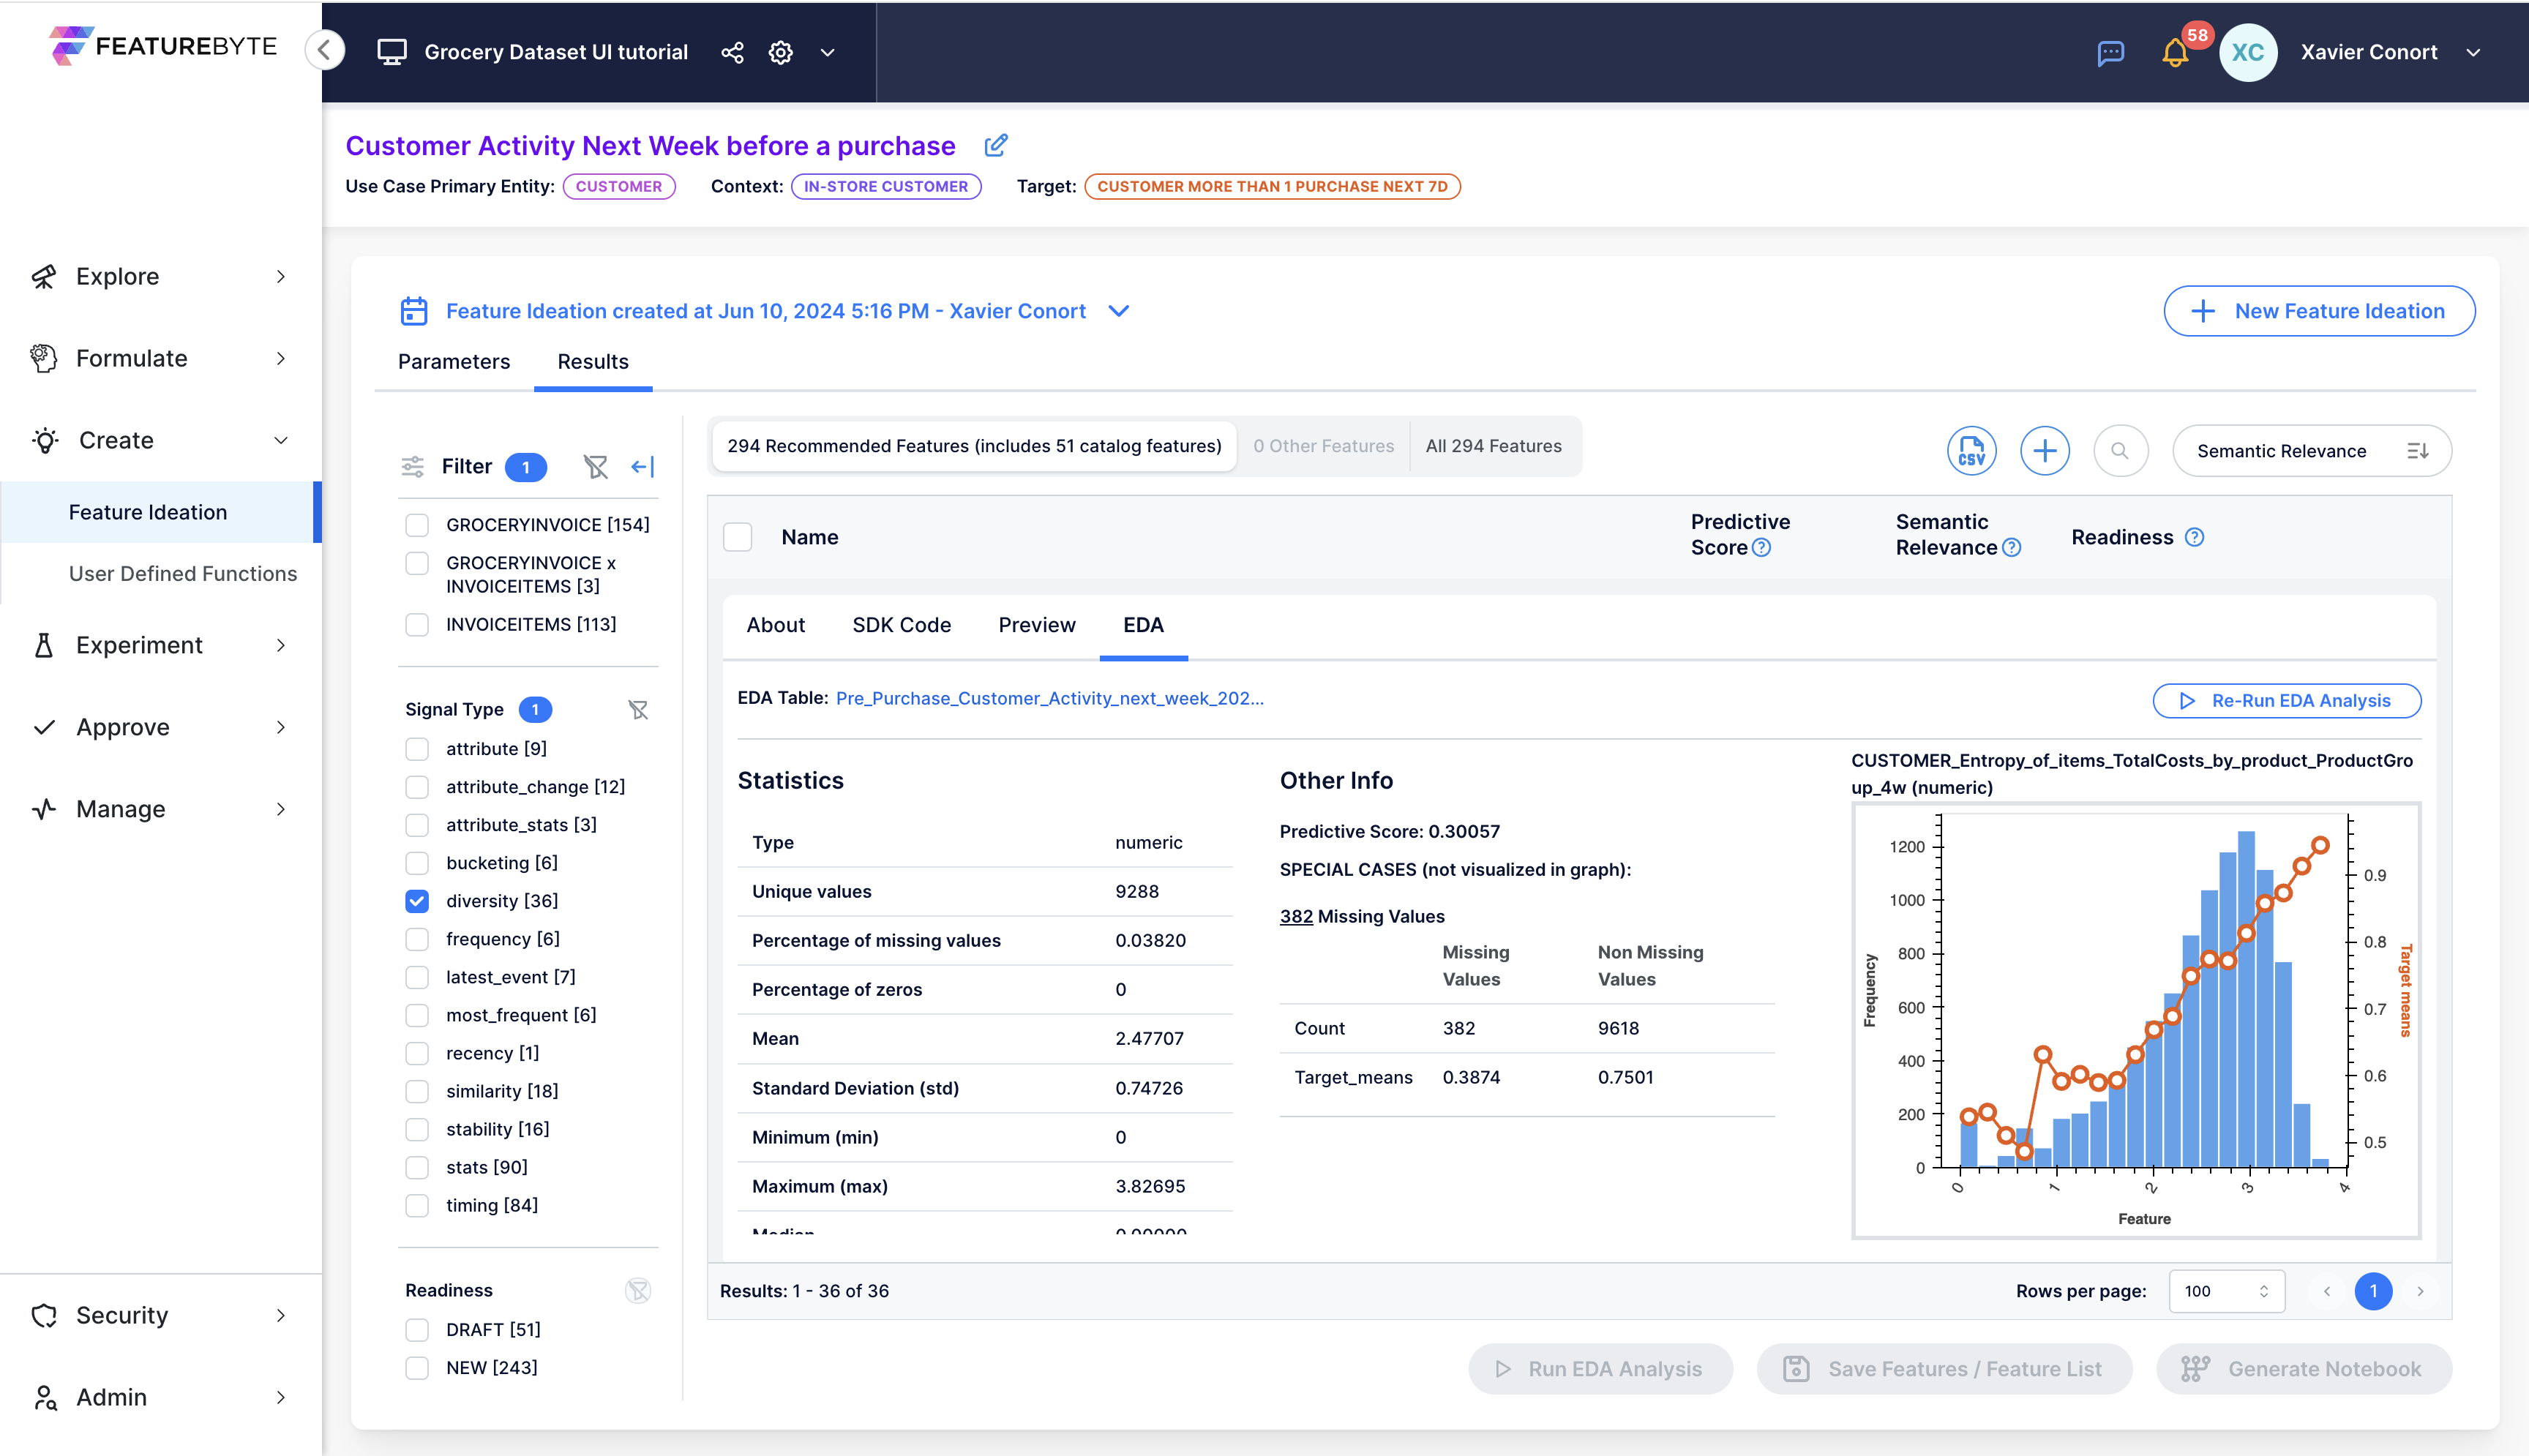
Although the feature's predictive power may not be as strong as "CUSTOMER_Count_of_invoices_4w," it should be valuable in a feature list because it captures a different signal than frequency. This assumption is confirmed by the Generative AI assessment.

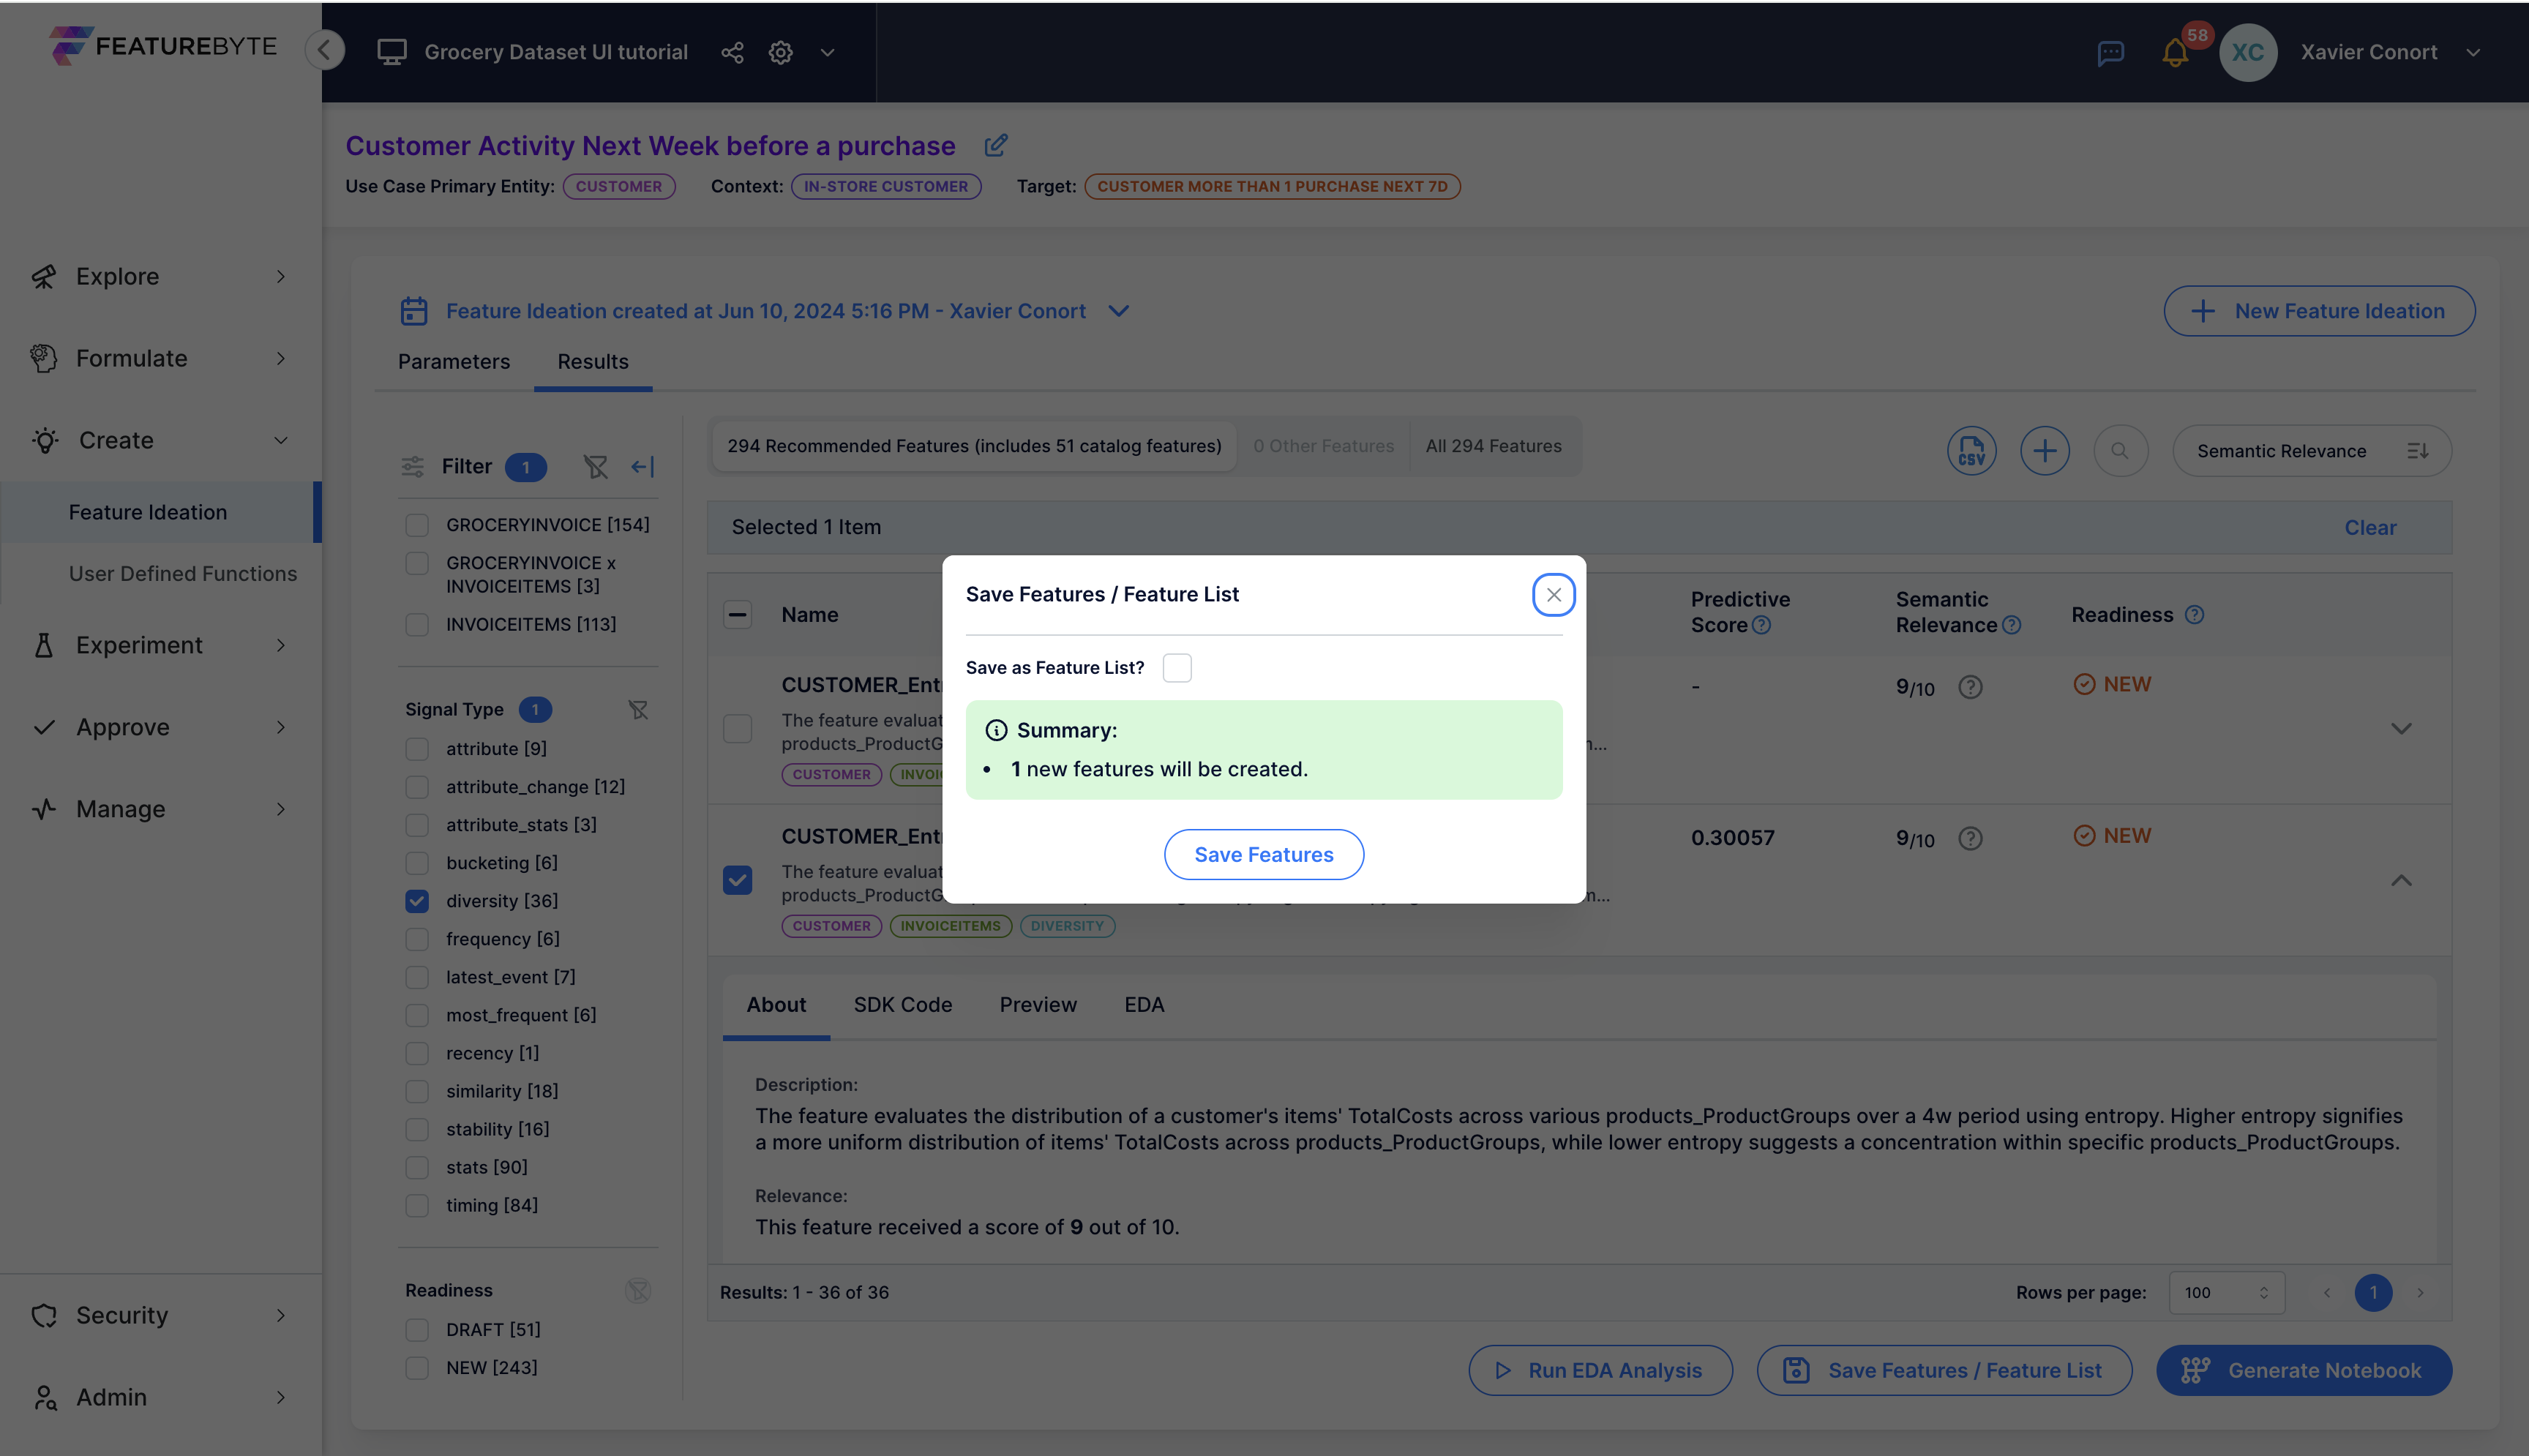
Before adding the feature to the Feature Catalog, let's clear any previous selection if you might have done.
![]()
You can now select the feature and add it to the Feature Catalog by clicking on 
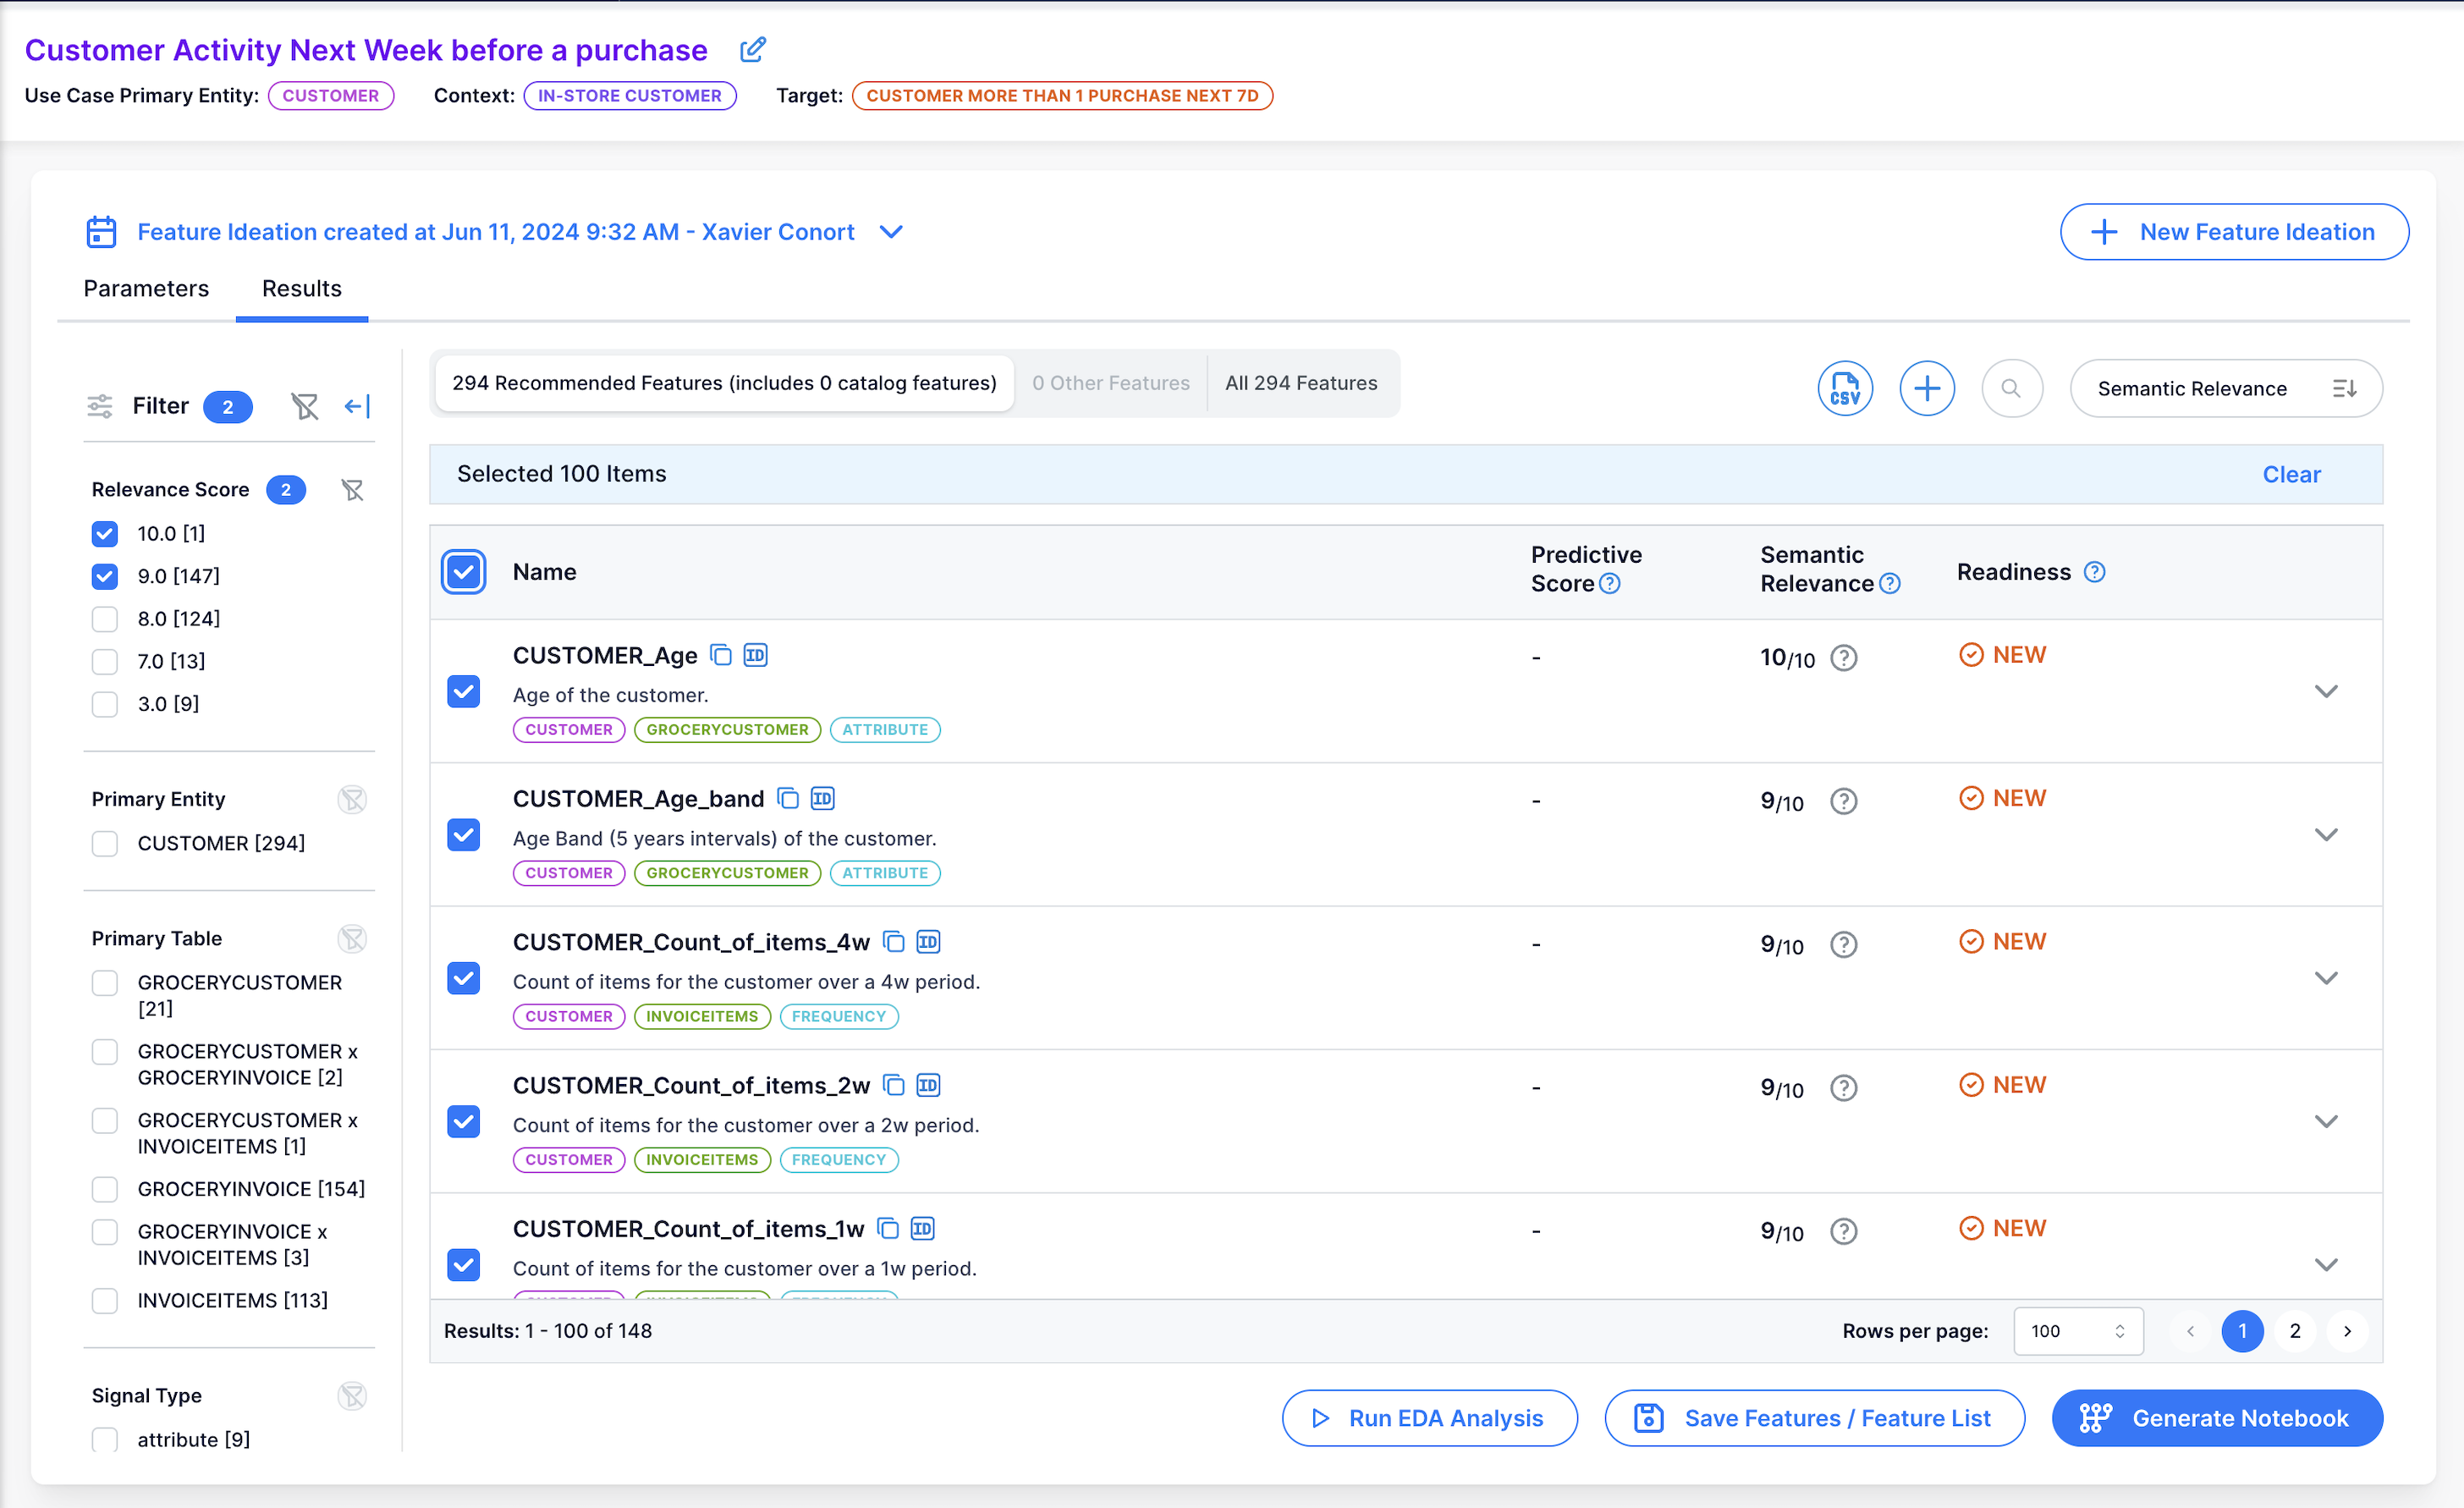
Run EDA for features with high semantic relevance
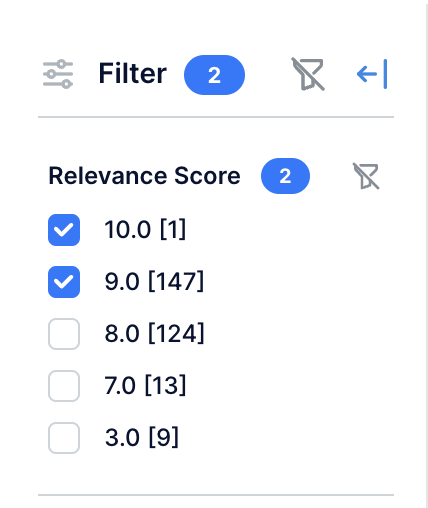
Clear any prior search. Clear previous selection in the filter bar 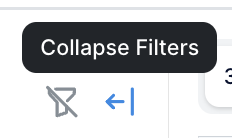 and select 9 and 10 Relevance Scores.
Select 100 features by checking the check box next to 'Name'.
Go to the second page if any.
Select remaining features by checking the check box next to 'Name'.
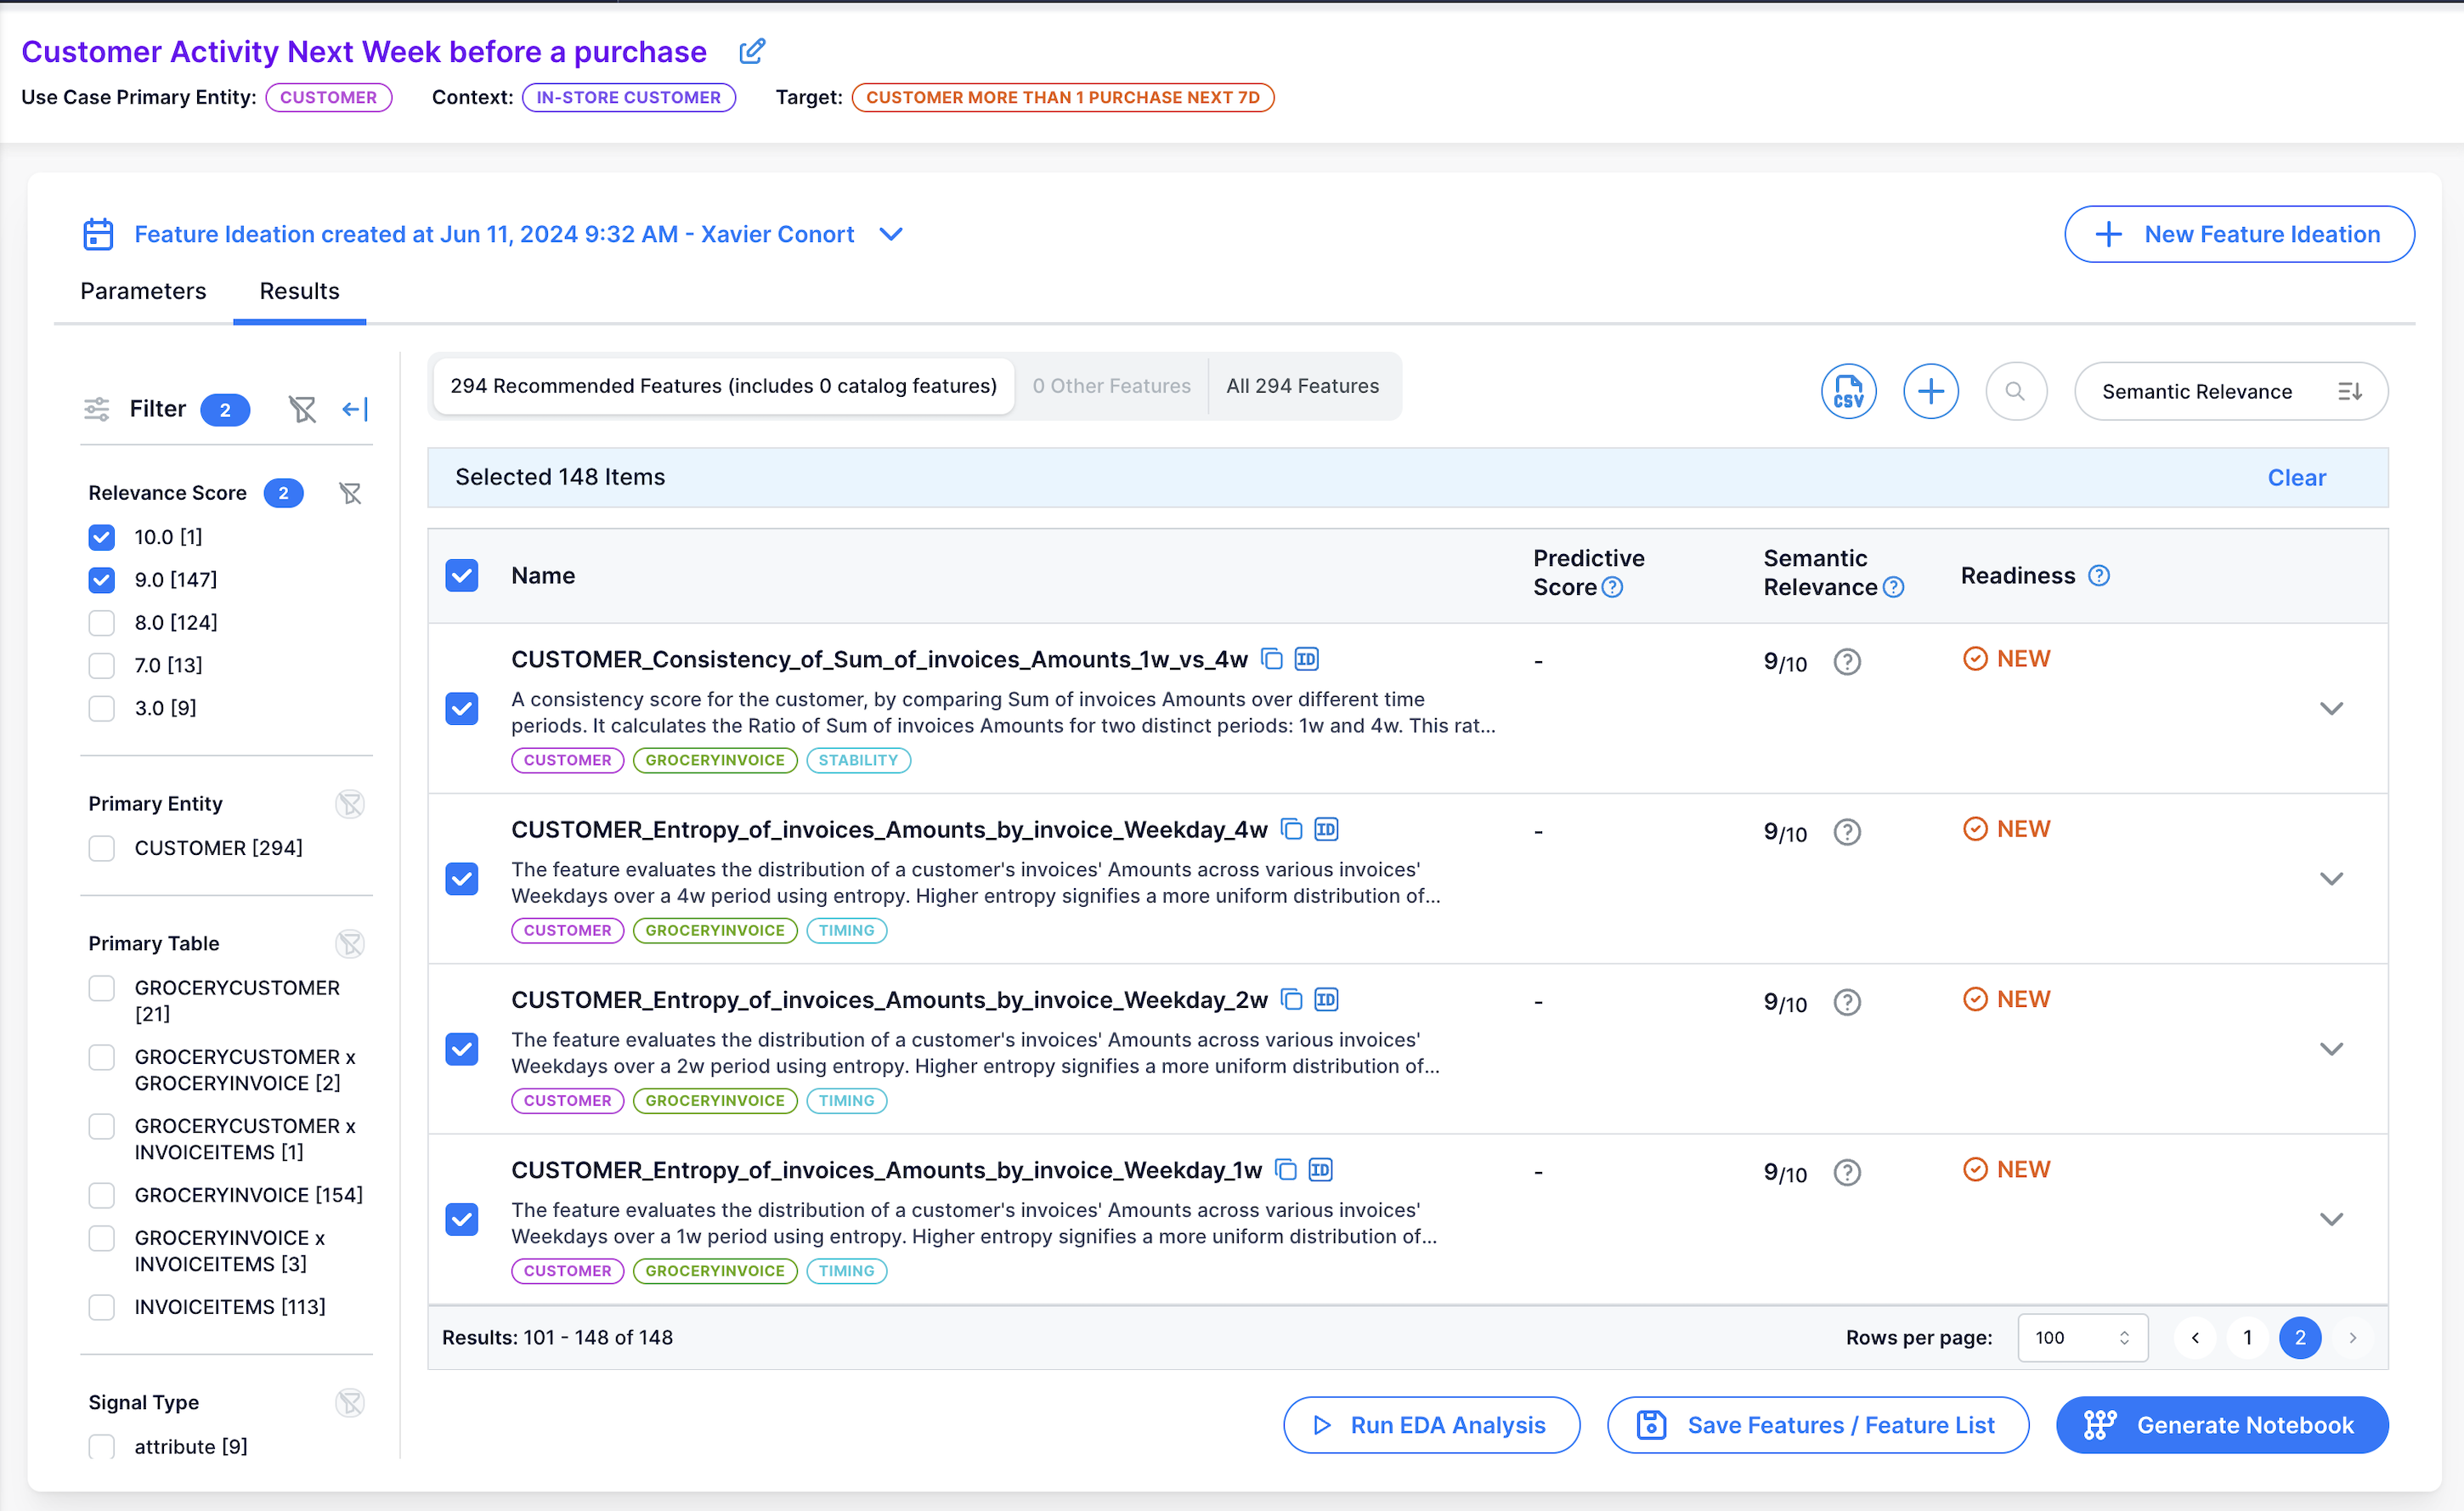
Run EDA for all selected features by clicking on 'Run EDA Analysis'. This should take less than 3 minutes.

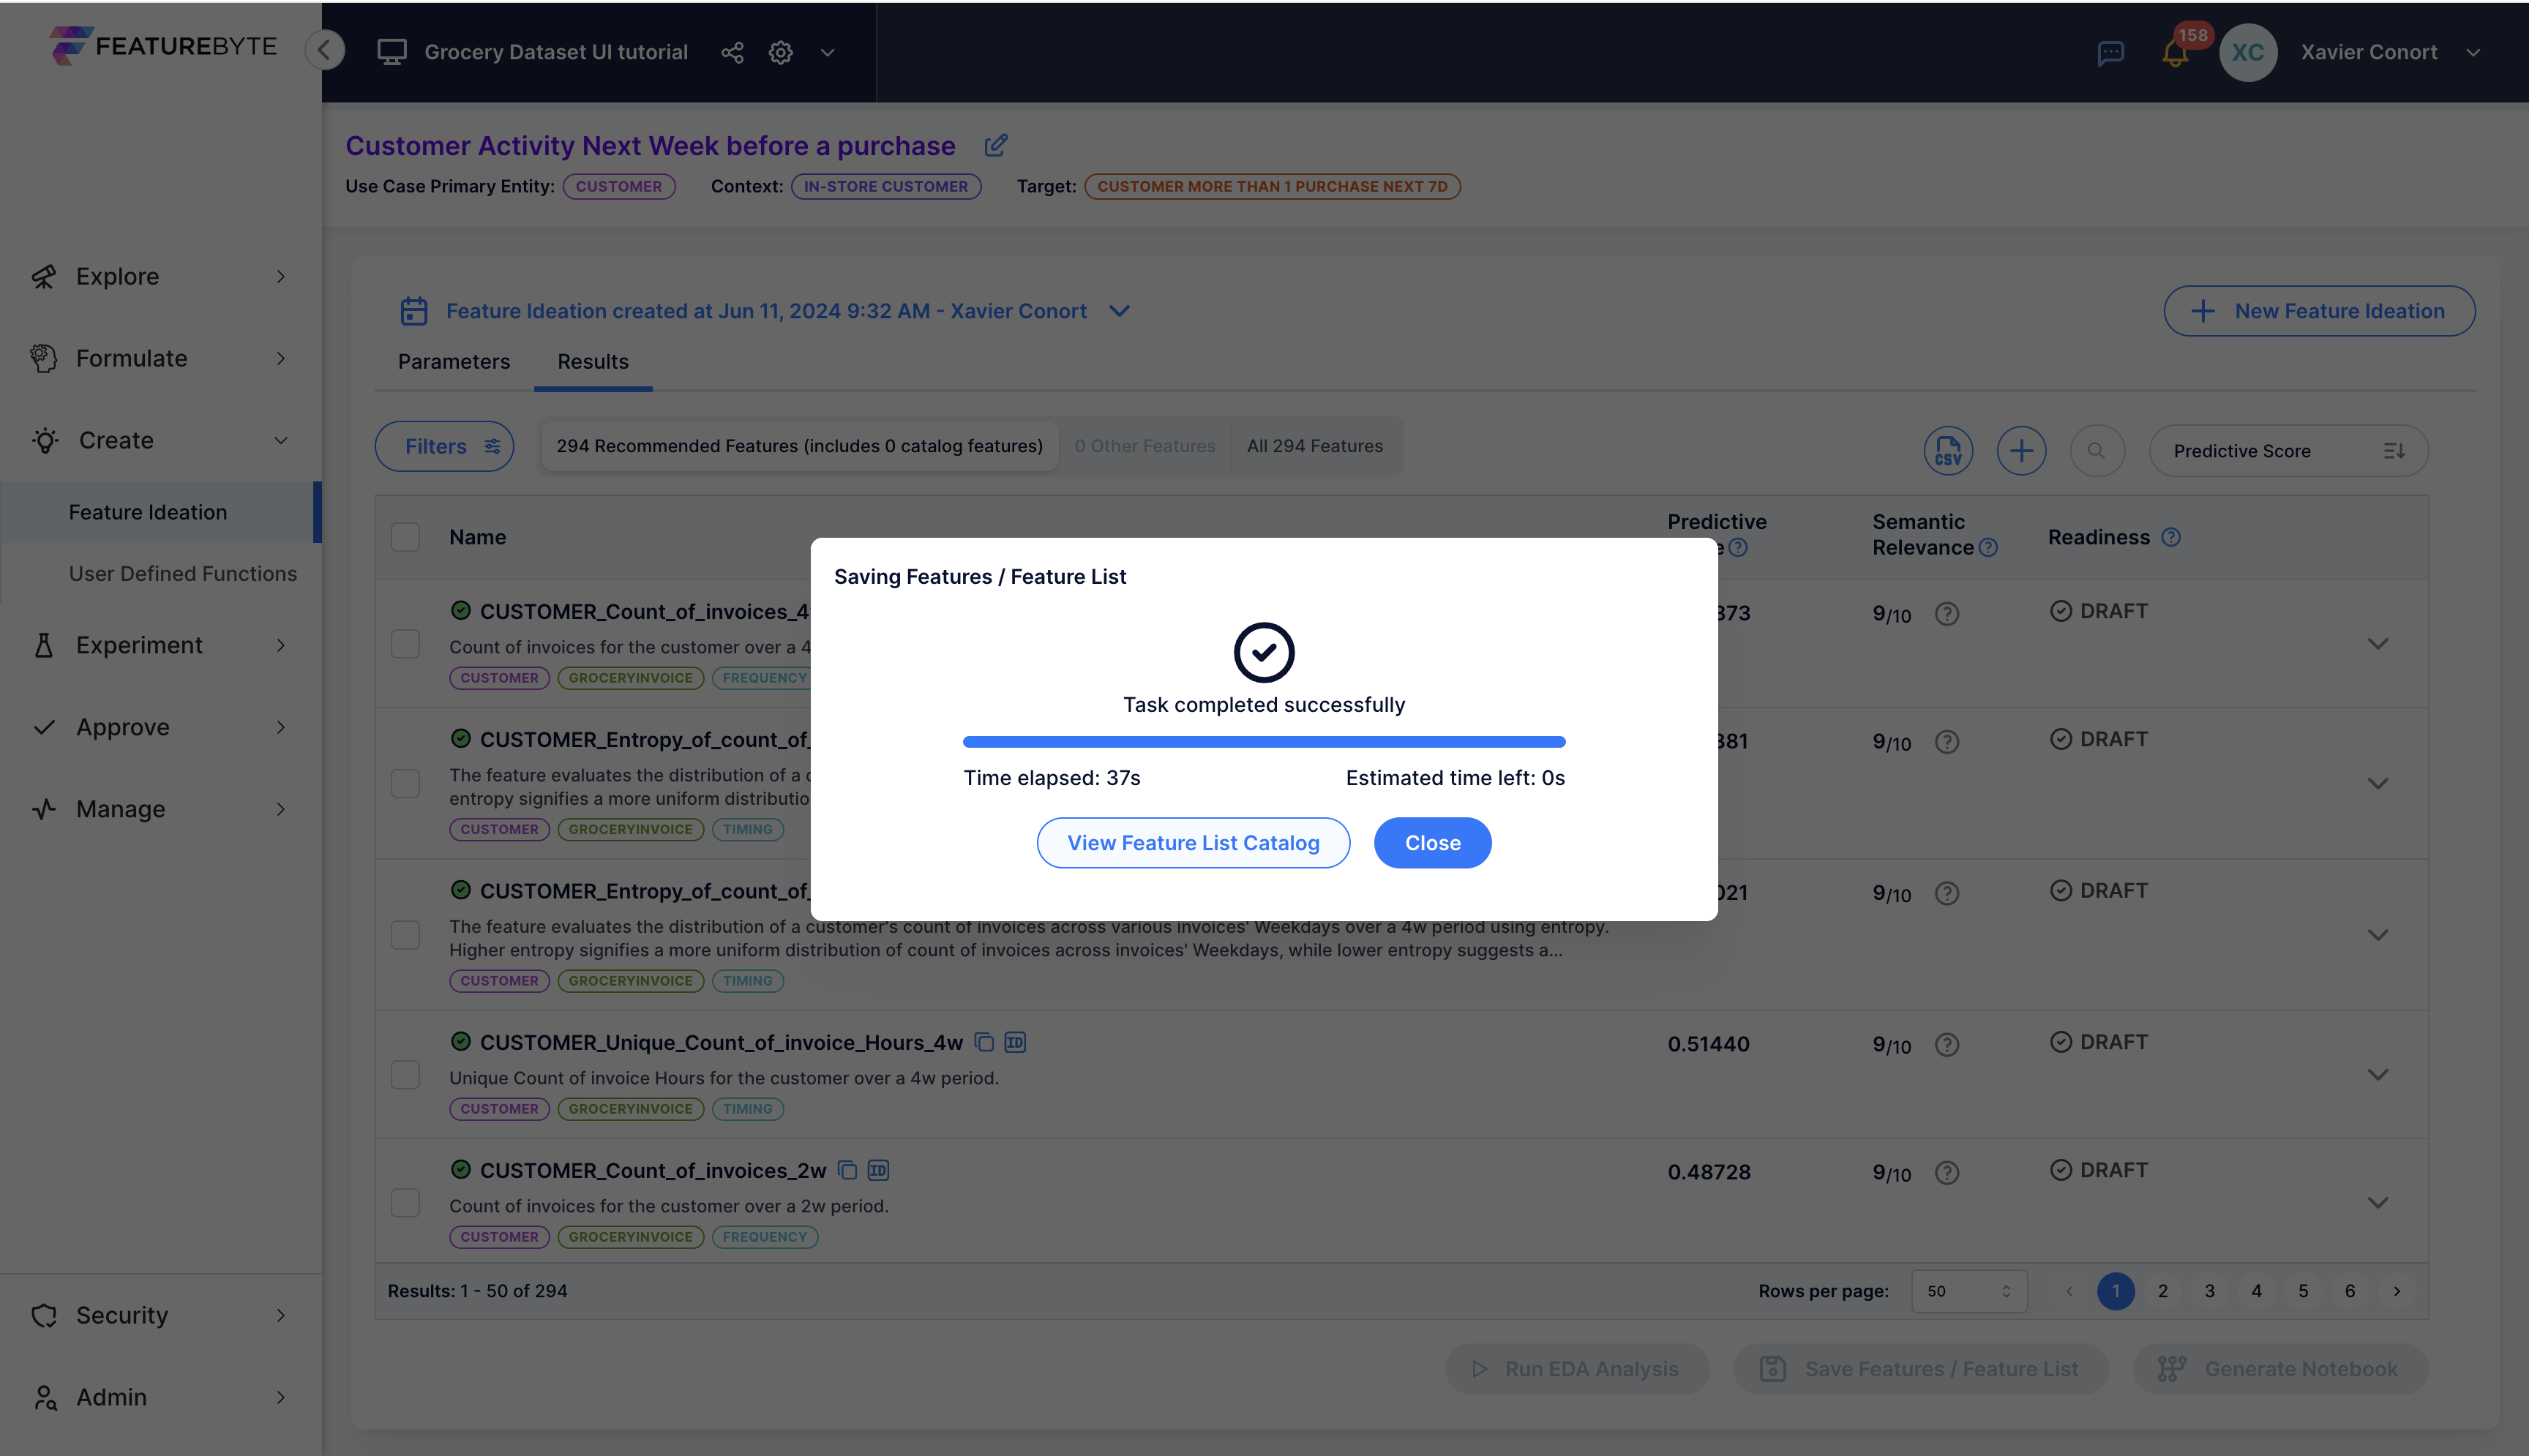
Add 50 features based on their predictive powers
Clear the filter and collapse the filter bar:
Clear the previous selection.
![]()
Go back to the first page.

Once done, you should get an unfiltered list:
![]()
Sort the results by the features' predictive scores.
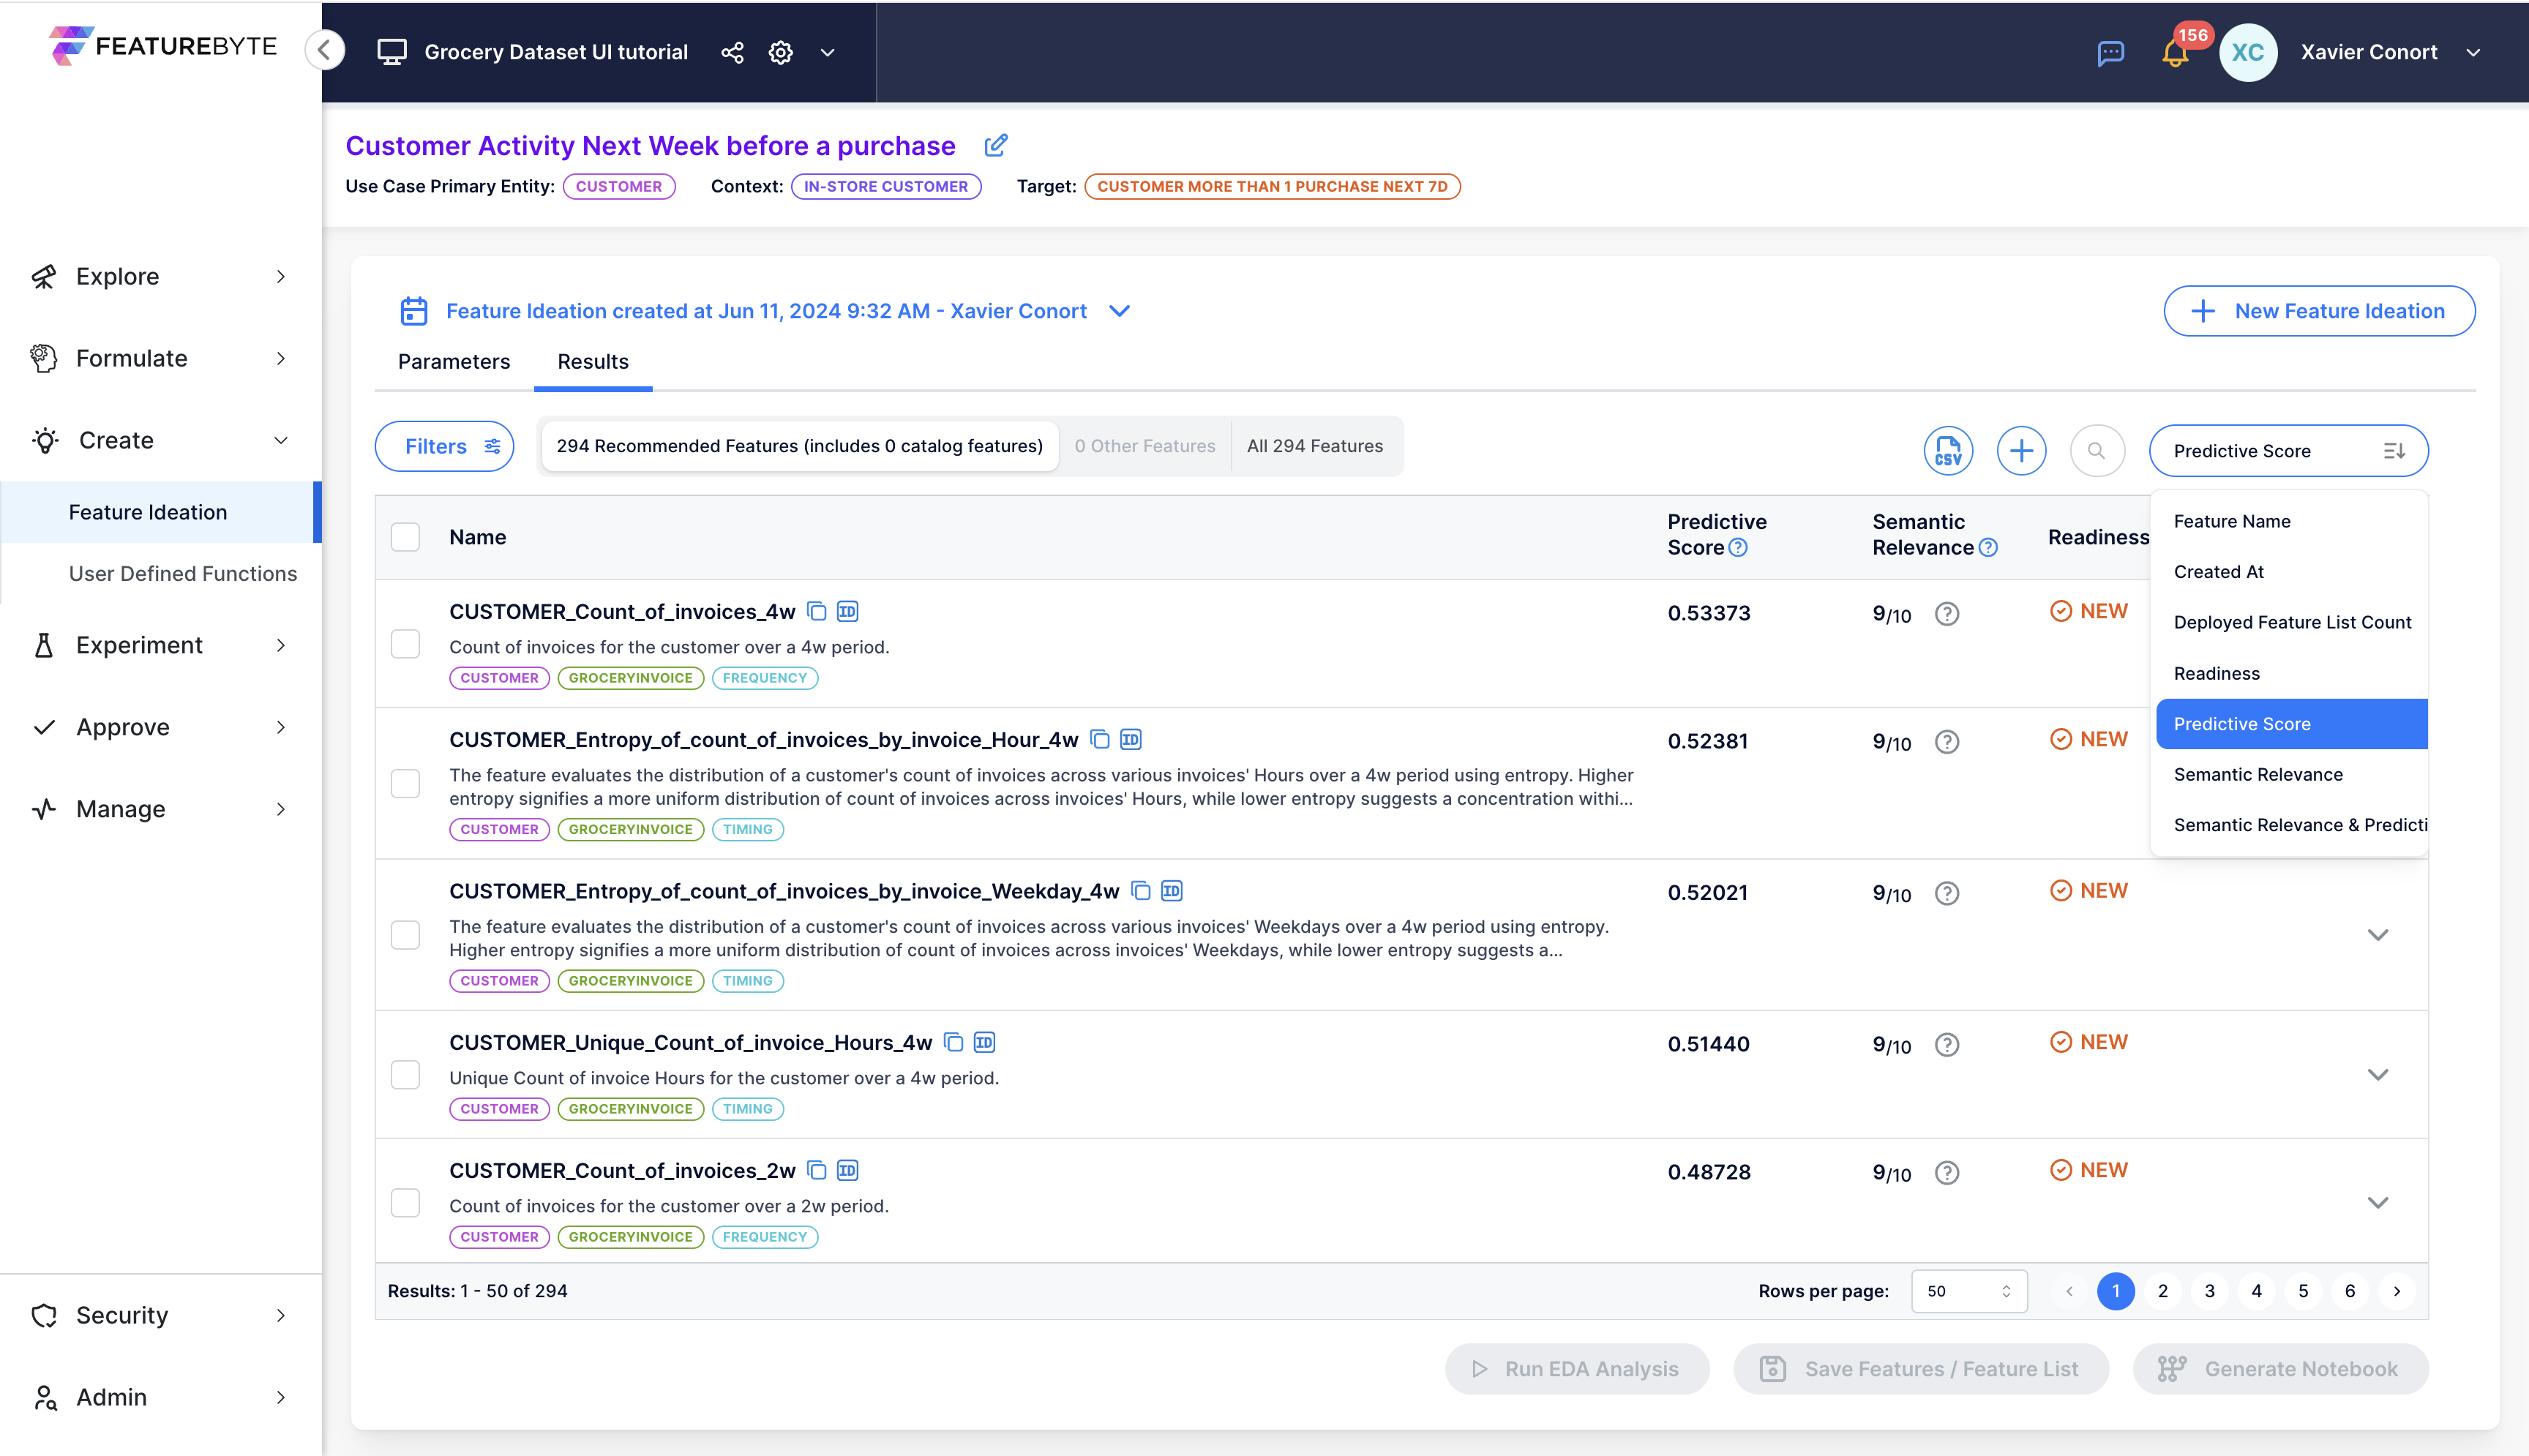
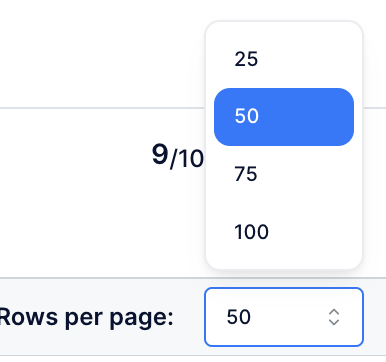
Change the number of features per page to 50.
Select the top 50 features by checking the check box next to 'Name'.
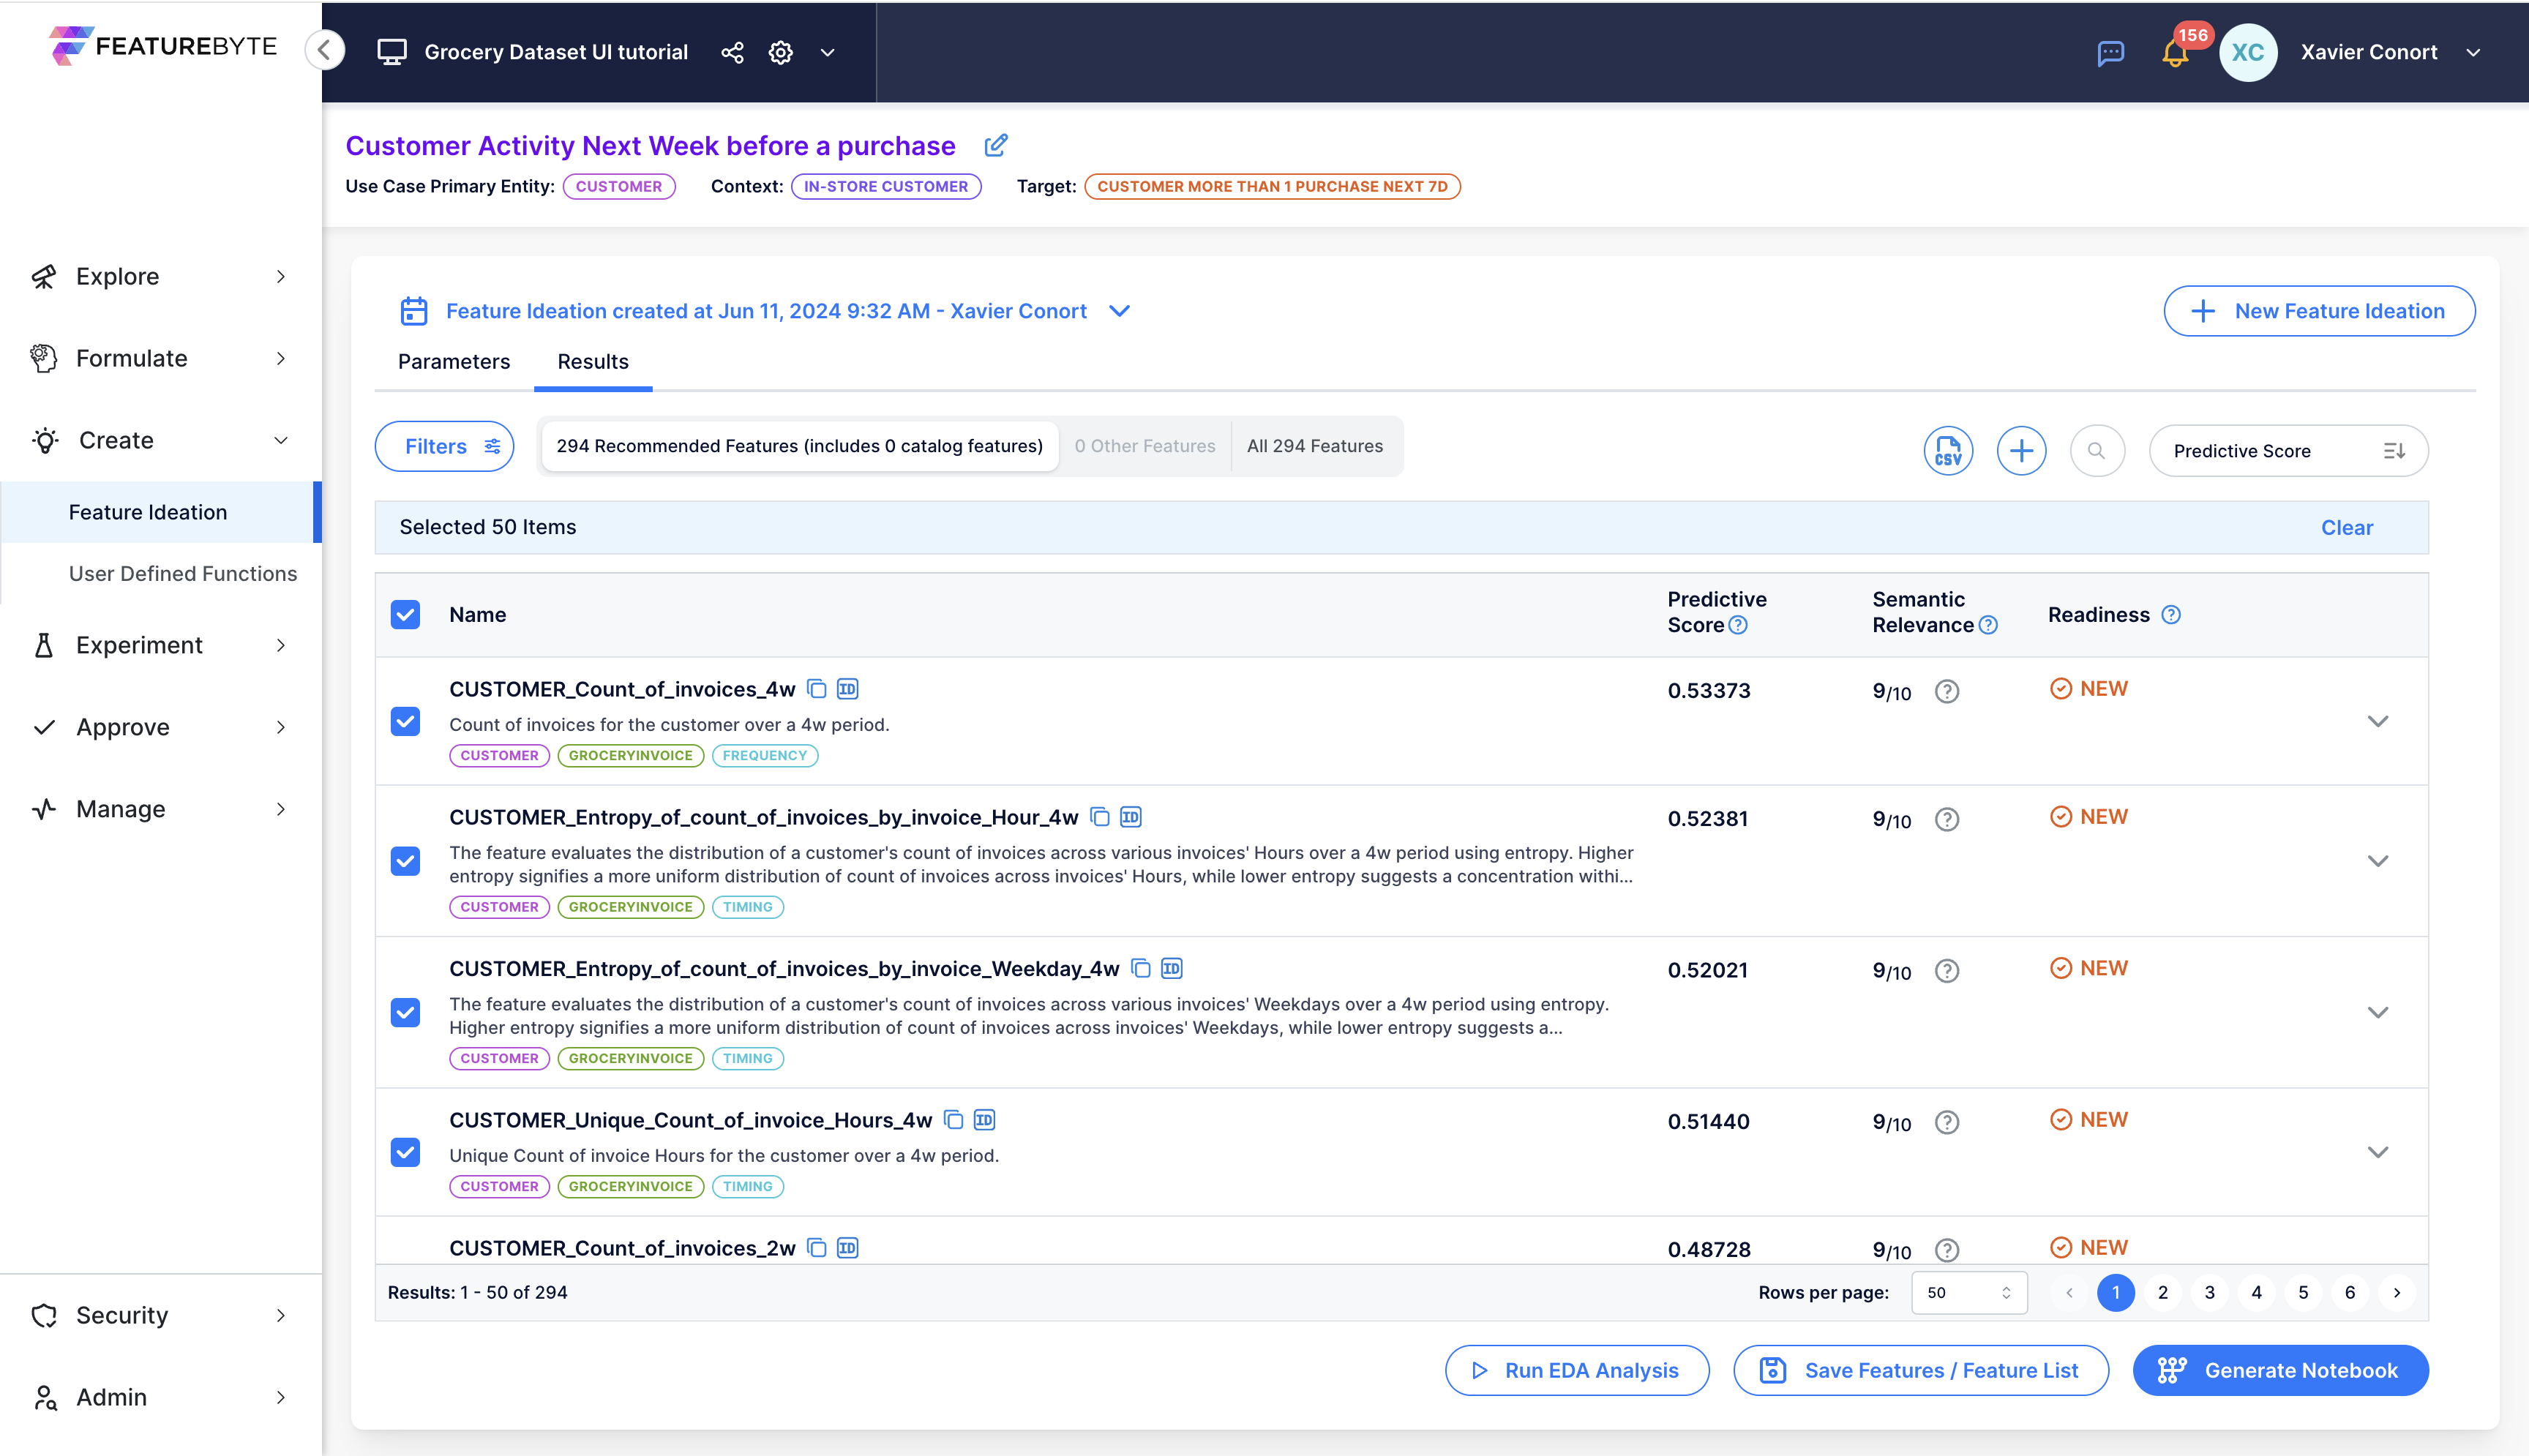
Let's add all these features to the Feature Catalog.